
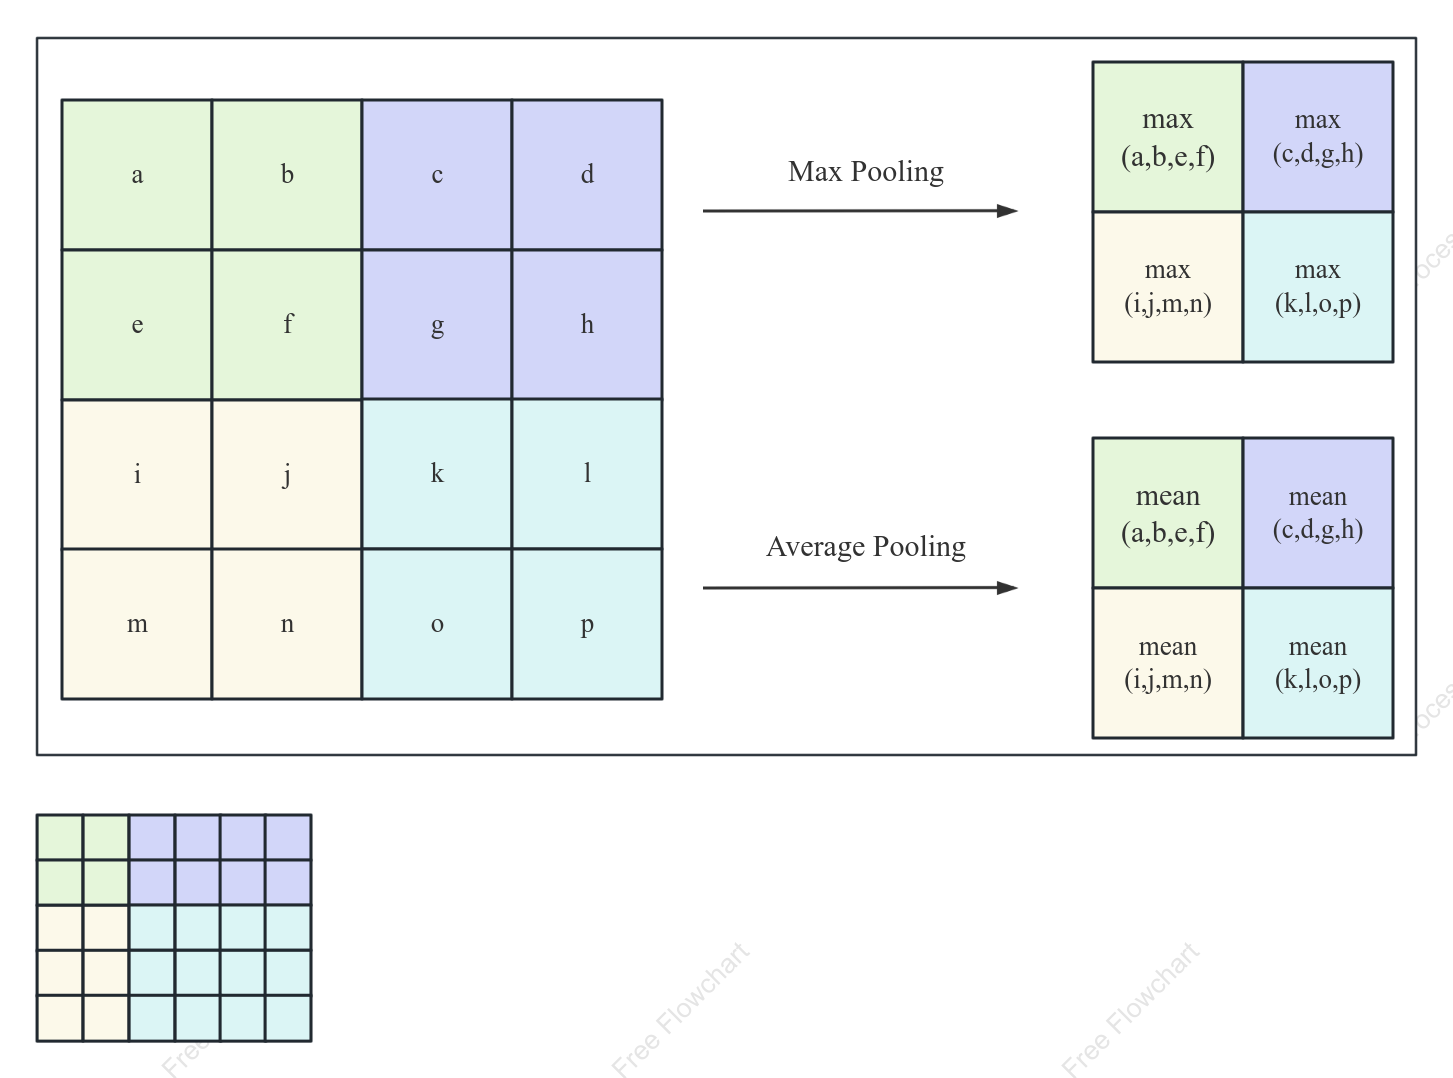

Diagram of Pooling Operations
0 Report
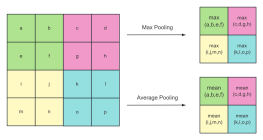
This diagram illustrates two common pooling operations used in deep learning convolutional neural networks. Using a 4x4 input matrix as an example, a 2x2 sliding window with a stride of 2 divides the matrix into four non-overlapping regions. The upper section demonstrates "Max Pooling," which extracts the maximum value from the four elements in each region to produce a 2x2 downsampled matrix; the lower section demonstrates "Average Pooling," which calculates the average value of the four elements in each region, likewise yielding a 2x2 result matrix. The diagram intuitively demonstrates the core mechanism by which pooling layers reduce computational load and extract key features through the reduction of spatial dimensions.
Related Recommendations
Other works by the author
Outline/Content
See more
f
h
Average Pooling
k
p
g
l
m
Output
输出特征图
Max Pooling
n
e
c
i
o
b
a
j
d
Collect
Collect
Collect
Collect

0 Comments
Next Page