
Column chart type
1 Report
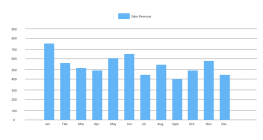
This column chart provides a comprehensive overview of various data sets, including the online and offline sales of products across different categories, the population proportions of different age groups in various cities, and the gender distribution of employees within a company. By visualizing these diverse data points, the chart aims to facilitate a better understanding of sales dynamics, demographic trends, and workforce composition. This structured representation is designed to aid in strategic planning and decision-making processes by highlighting key patterns and insights across multiple domains.
Related Recommendations
Other works by the author
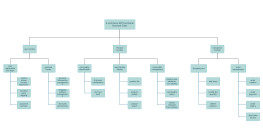
Outline/Content
See more
%
Online and offline sales of products in different categories
Population proportion of different age groups in different cities
Number of male/female employees in the company
Sales of products in different categories
Collect
Collect
Collect

Collect

Collect
Collect


0 Comments
Next Page