
Bar chart type
0 Report
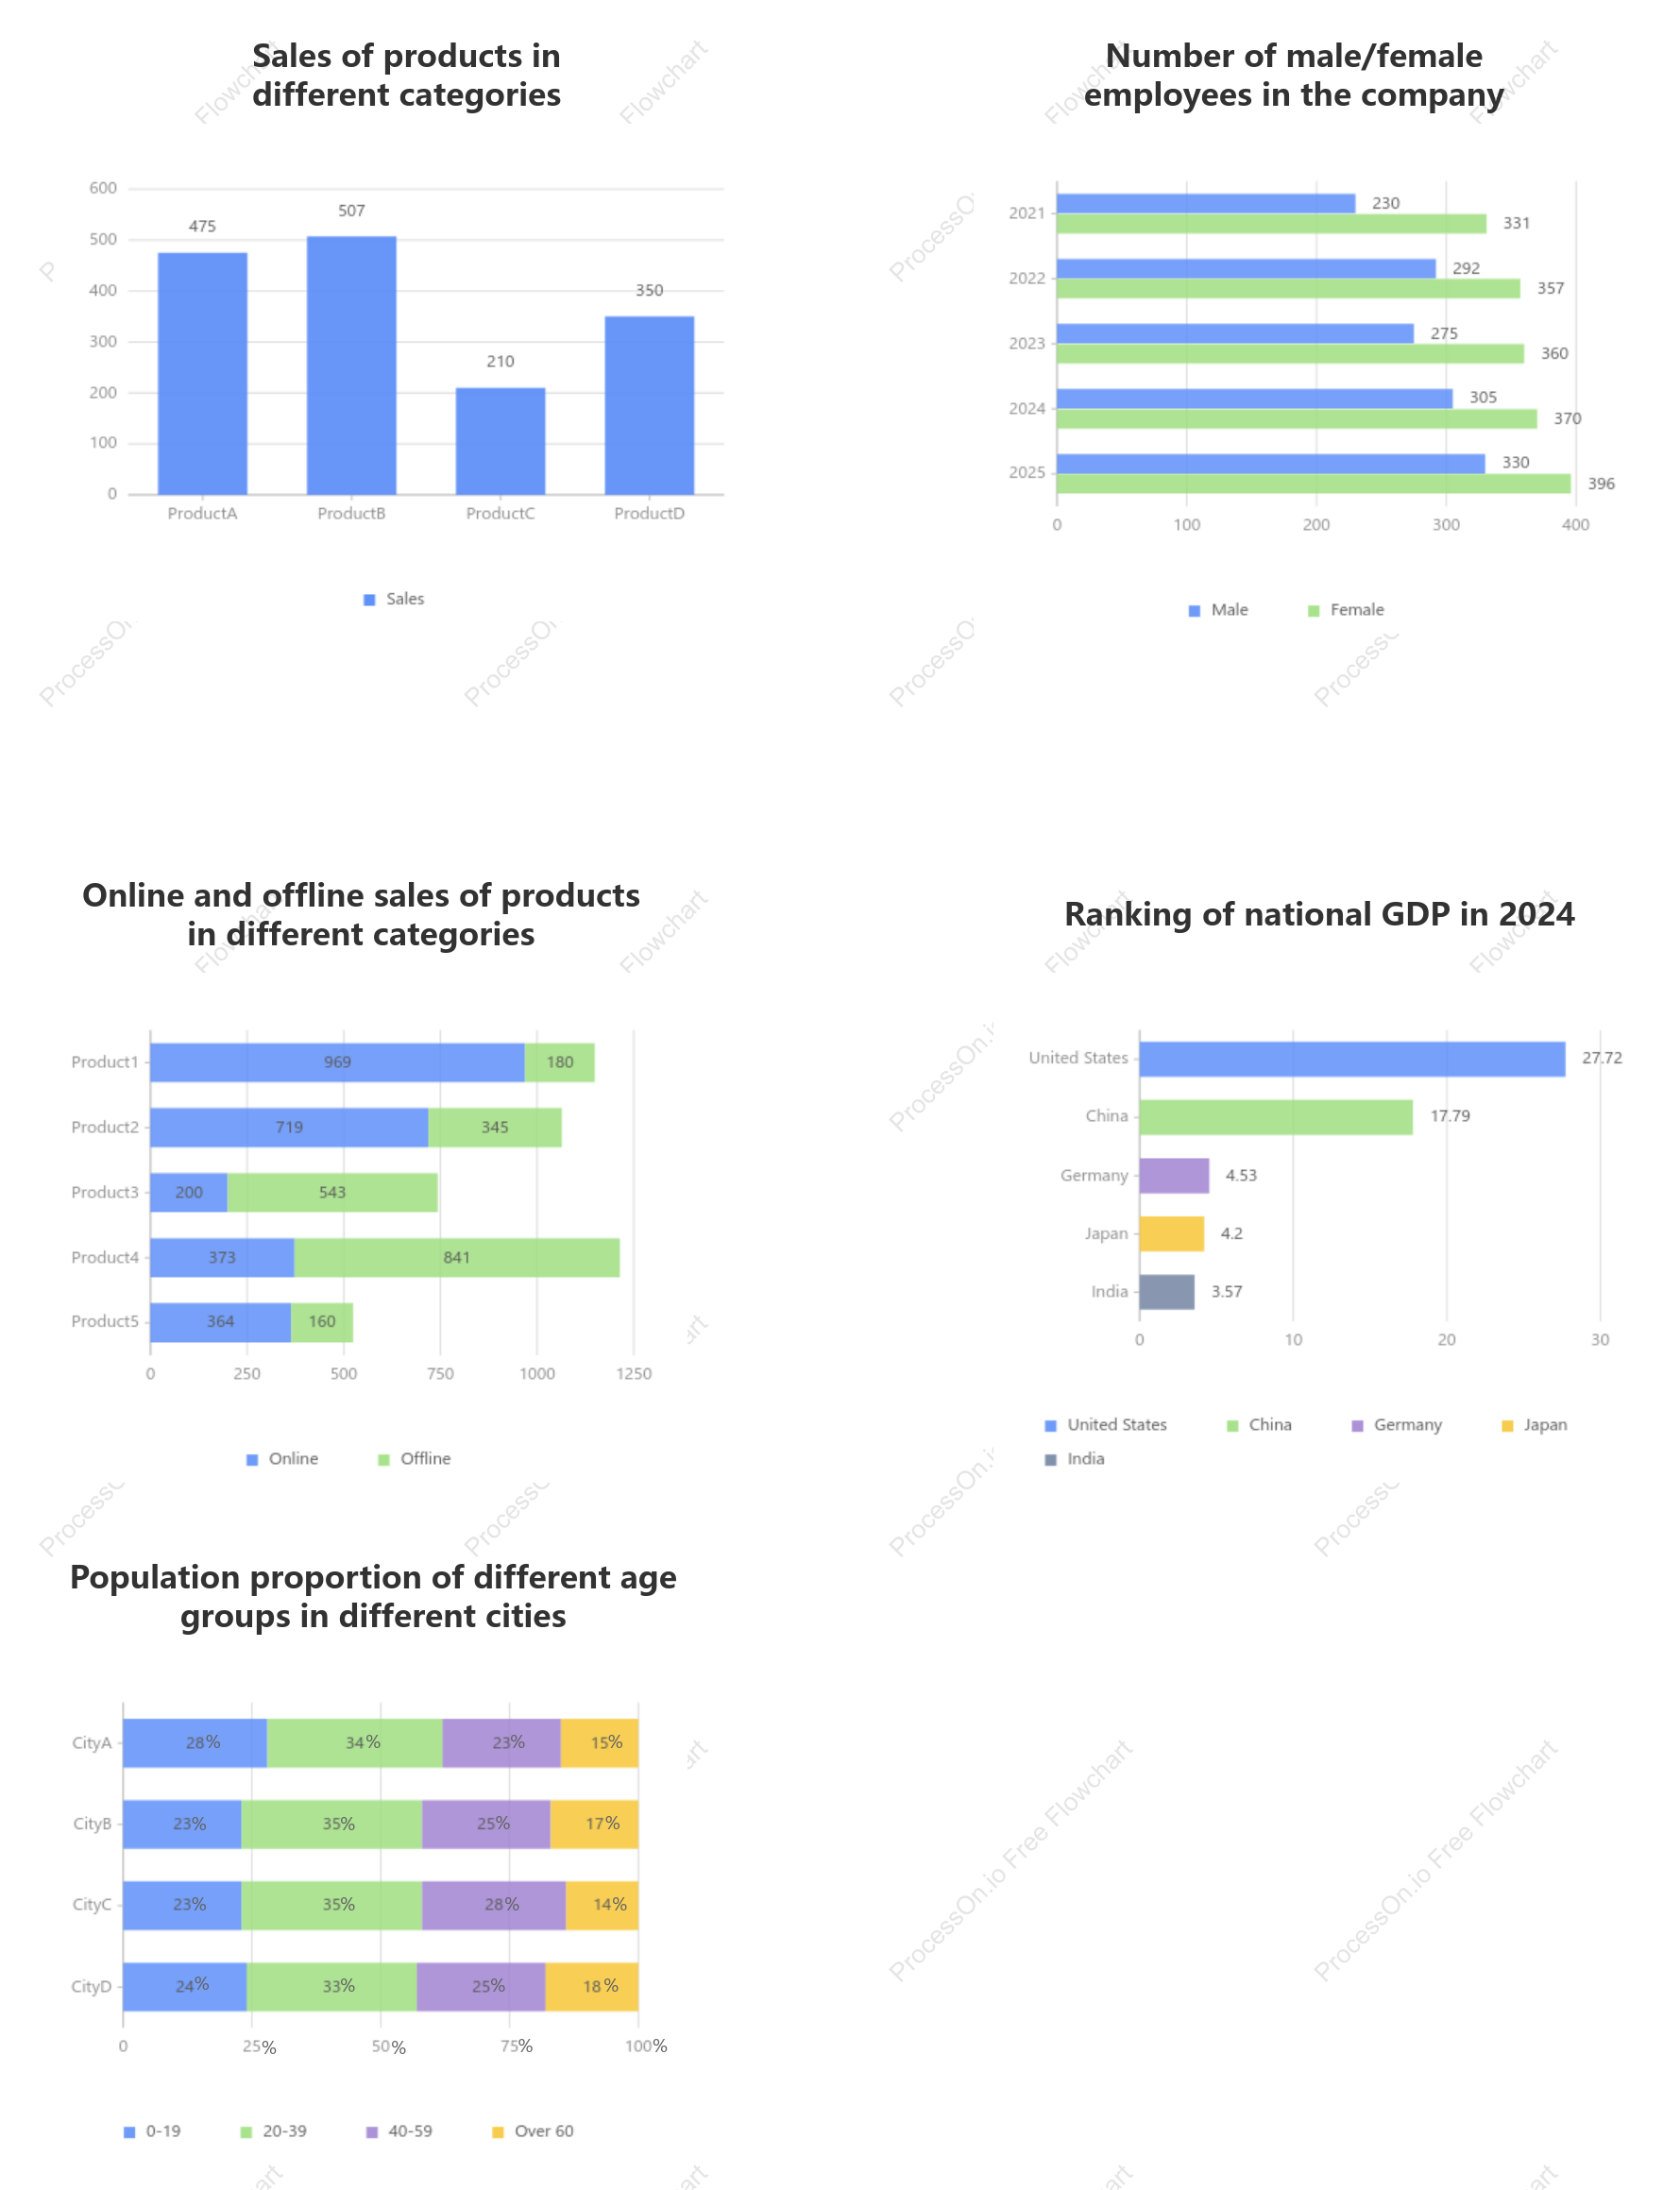
This is a bar chart type flowchart, designed to illustrate various datasets. It focuses on the online and offline sales of products across different categories, providing insights into consumer purchasing trends. Additionally, it presents the population proportion of different age groups in various cities, offering a demographic overview. The chart also details the number of male and female employees within a company, highlighting gender distribution in the workplace. Furthermore, it ranks national GDP for 2024, giving an economic perspective. This comprehensive visualization serves as a valuable tool for analyzing these diverse data points effectively.
Related Recommendations
Other works by the author
Outline/Content
See more
%
Online and offline sales of products in different categories
Population proportion of different age groups in different cities
Number of male/female employees in the company
Ranking of national GDP in 2024
Sales of products in different categories


Collect
Collect
Collect
Collect


0 Comments
Next Page