
Stacked bar chart
0 Report
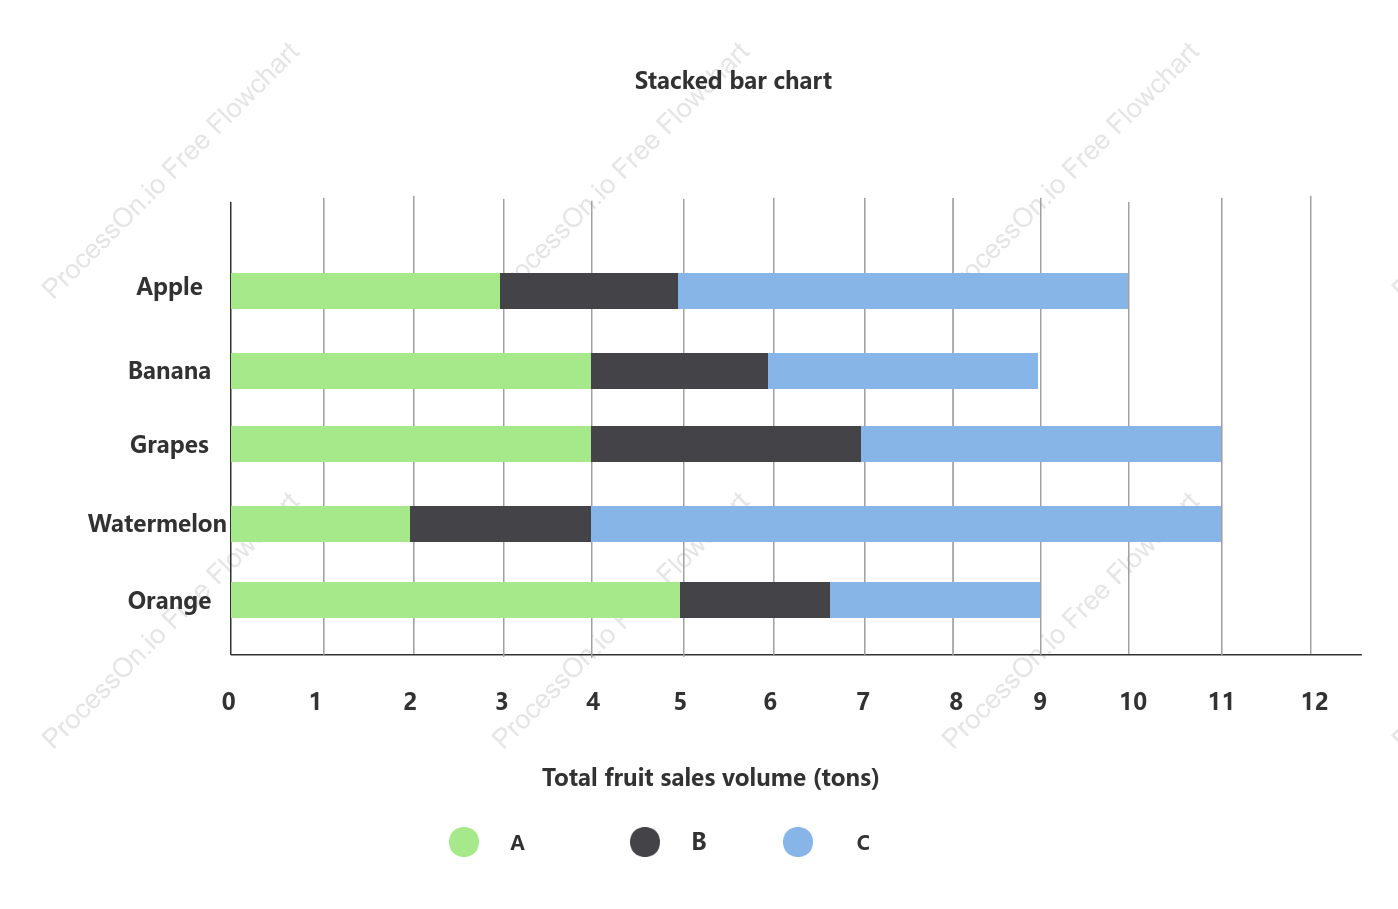
This stacked bar chart provides a visual representation of total fruit sales volume, measured in tons, for various fruits including apples, bananas, watermelons, oranges, and grapes. Each segment within the bars represents the contribution of different categories labeled A, B, and C, illustrating their respective sales volumes. The chart allows for easy comparison of the sales performance of each fruit type, highlighting which fruits have the highest and lowest sales. This visual tool is essential for analyzing trends and making informed decisions regarding fruit sales strategies.
Related Recommendations
Other works by the author
Outline/Content
See more
Apple
0
Stacked bar chart
11
B
A
Banana
10
5
Watermelon
6
1
Total fruit sales volume (tons)
12
C
9
4
2
7
8
Orange
3
Grapes


Collect

Collect


0 Comments
Next Page