
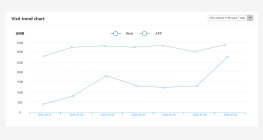
E-commerce website sales line chart
0 Report
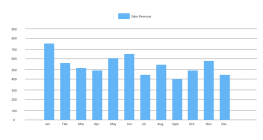
This is an e-commerce website sales line chart, illustrating the quarterly sales revenue in million USD throughout the year. The chart provides a clear visual representation of the turnover for each quarter: 182 million USD in the first quarter, 41 million USD in the second quarter, and 200 million USD in the third quarter, with a notable increase to 257 million USD in the fourth quarter. This chart serves as a valuable tool for analyzing sales trends and performance over the year, helping to identify patterns and inform future business strategies.
Related Recommendations
Other works by the author
Outline/Content
See more
302
50
C
First quarter
182
Second quarter
41
Third quarter
200
TurnoverUnit: m USD
176
198
0
A
167
250
Quarter
Quarterly sales revenue
100
127
218
78
B
300
150
63
257
Fourth quarter
Collect
Collect
Collect
Collect
Collect
Collect
Collect
Collect

0 Comments
Next Page