
Live streaming room timeline
0 Report
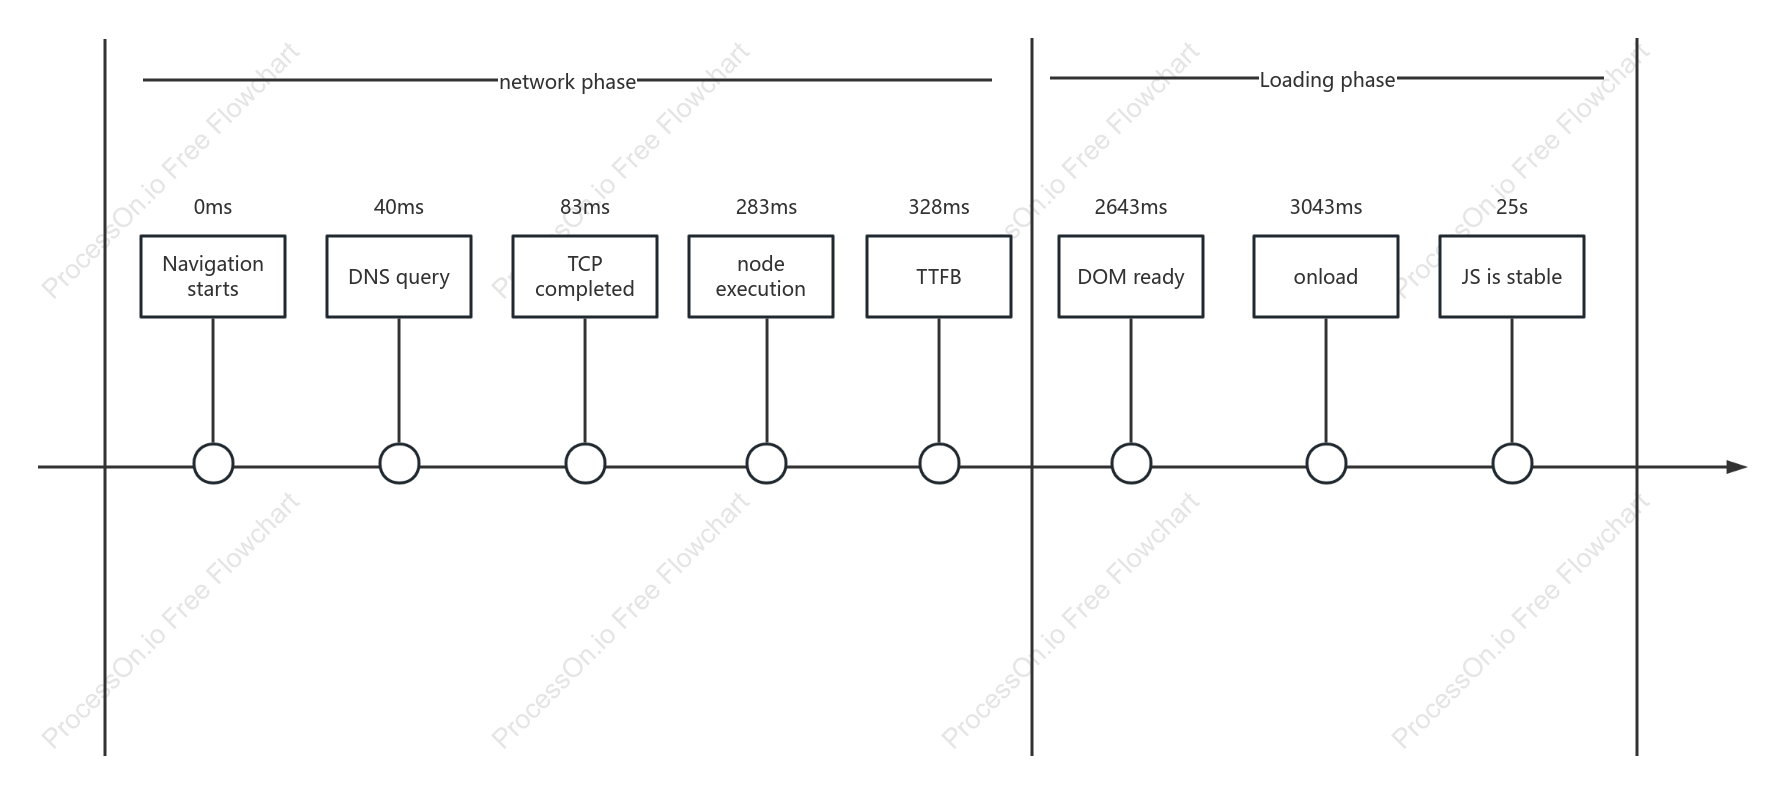
This is a live streaming room timeline flowchart, designed to illustrate the sequence of events during a live streaming session. The flowchart details key phases including network and loading phases, highlighting critical time markers such as DNS query at 3043ms, TCP completion, and DOM readiness at 2643ms. It also notes the stability of JavaScript and the execution of nodes. The timeline begins with navigation at 25 seconds, providing a comprehensive overview of the processes involved in setting up and maintaining a live streaming environment.
Related Recommendations
Other works by the author
Outline/Content
See more
40ms
onload
3043ms
DNS query
0ms
TCP completed
JS is stable
node execution
network phase
25s
Navigation starts
Loading phase
2643ms
TTFB
DOM ready
283ms
328ms
83ms


Collect

0 Comments
Next Page