
In-depth analysis framework for listed companies
0 Report
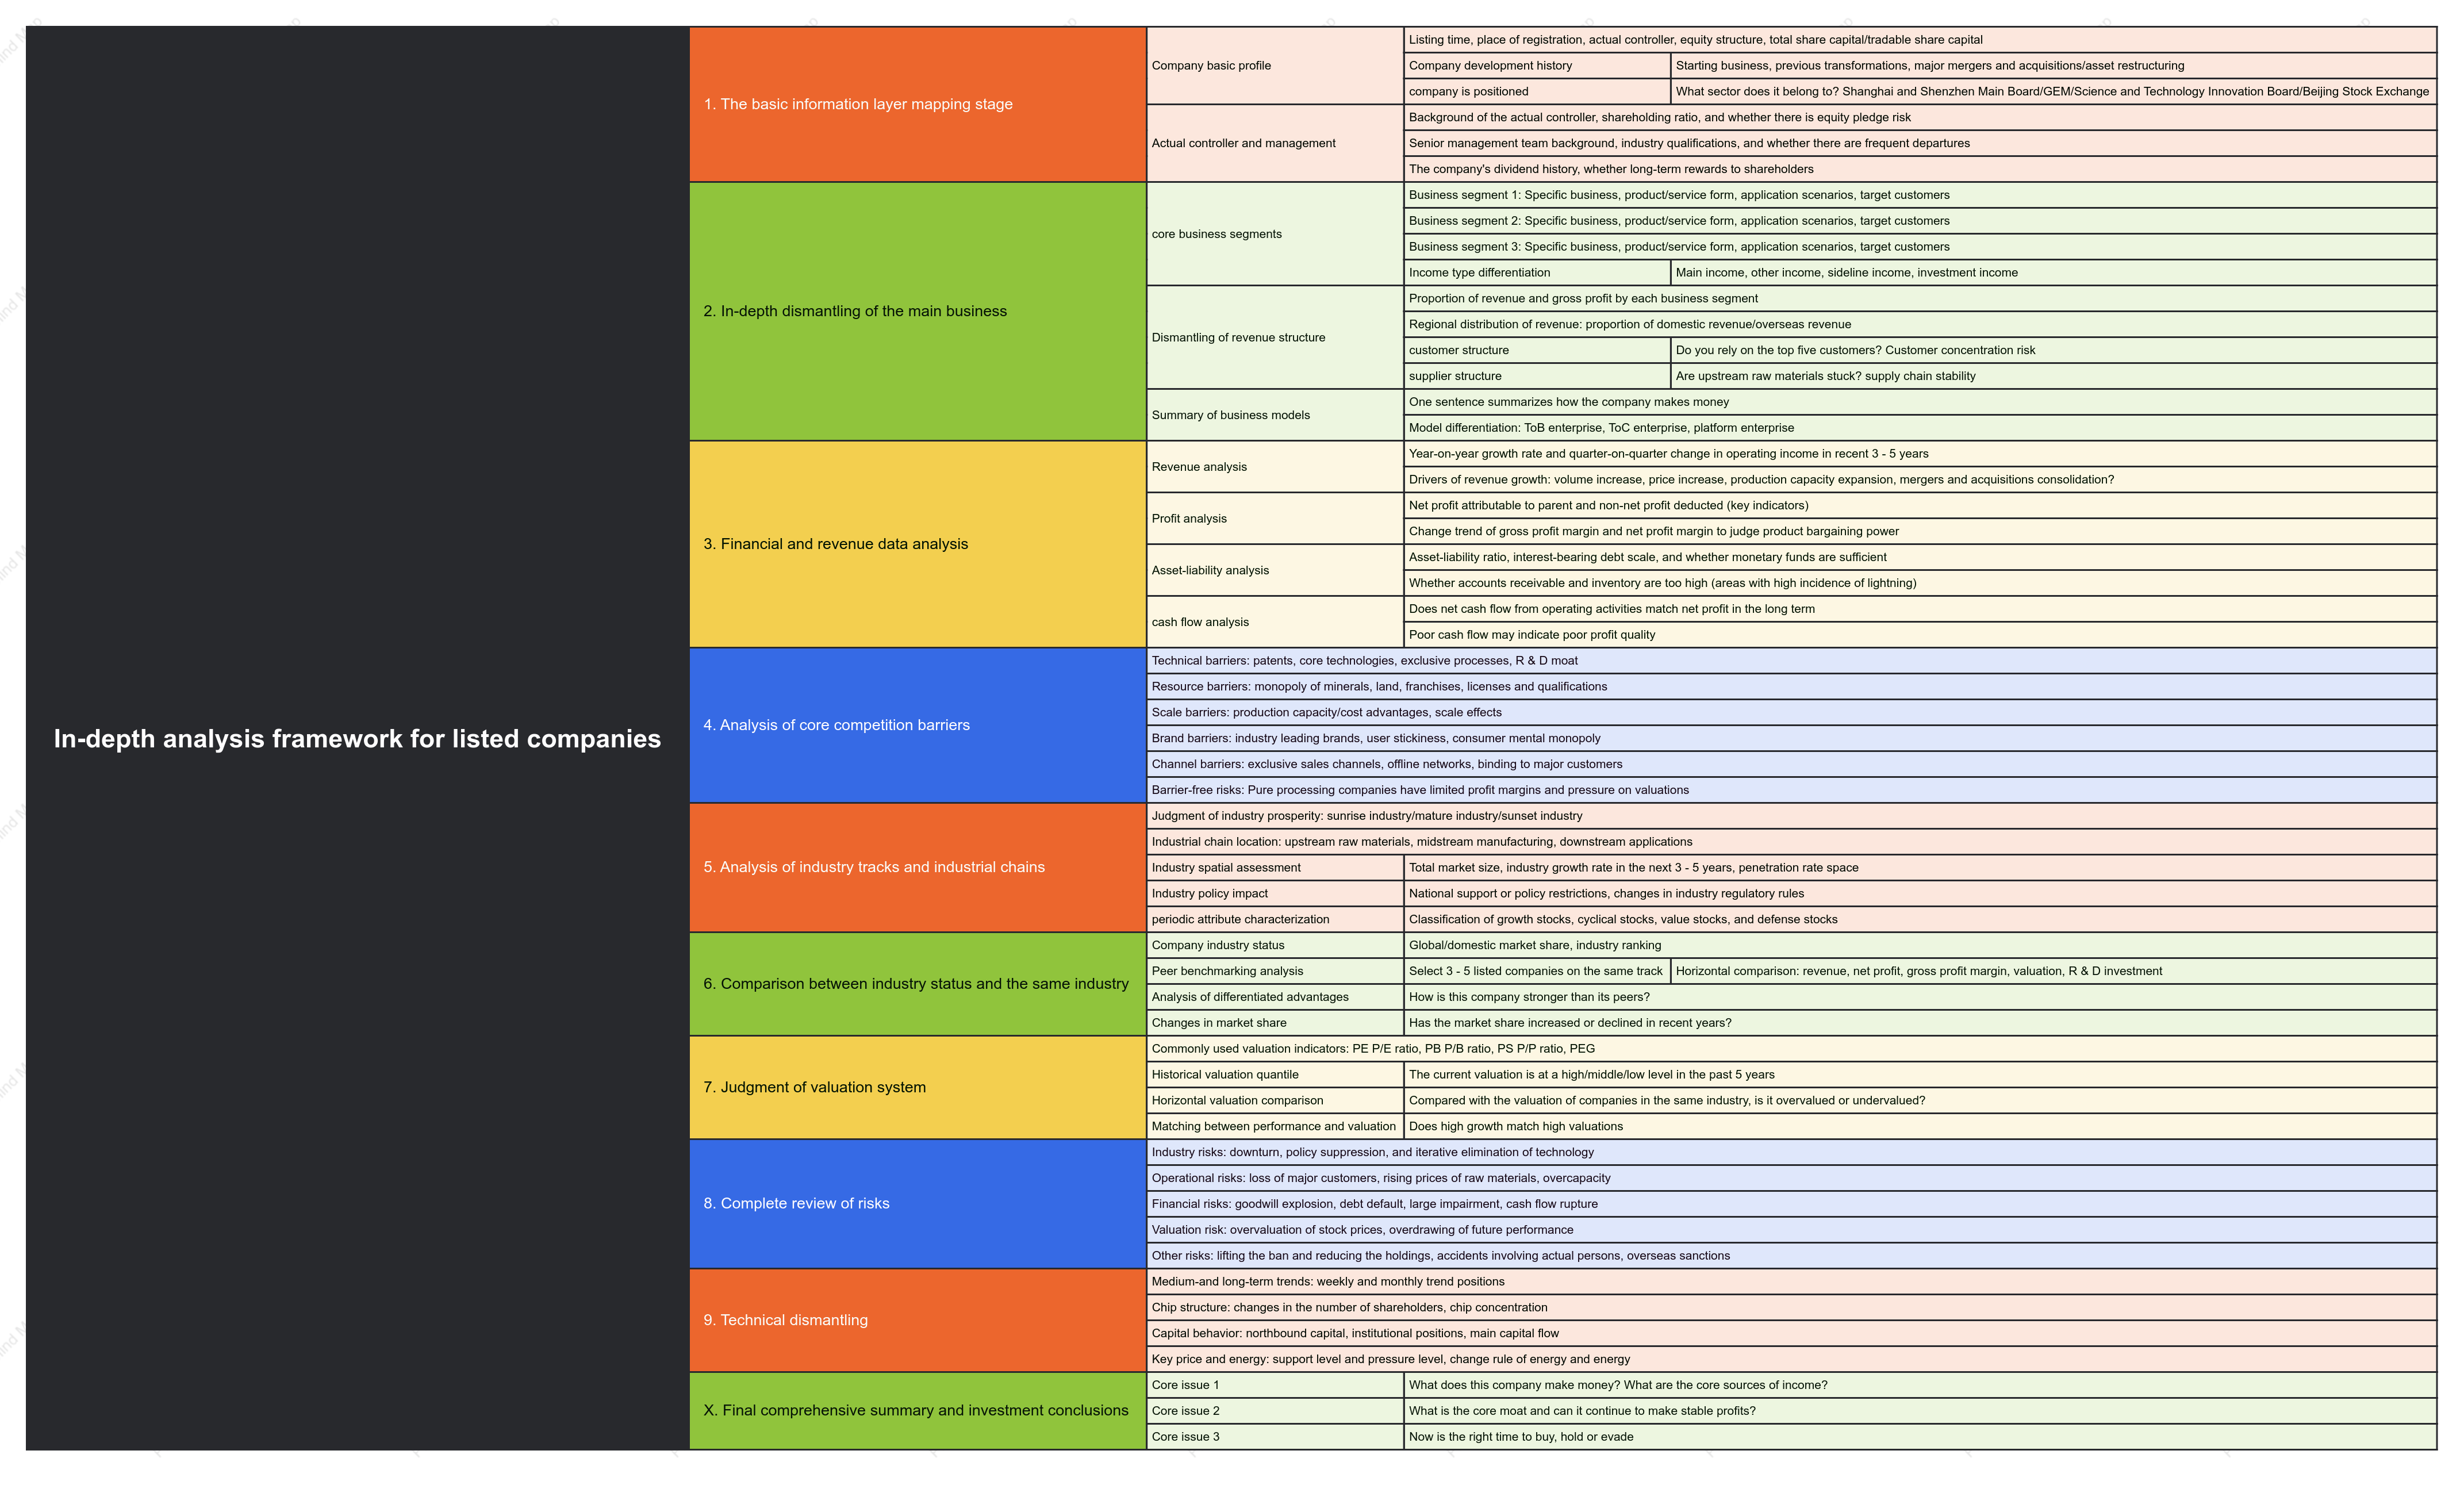
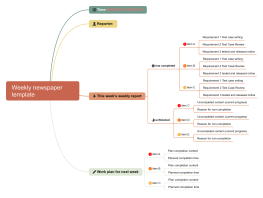
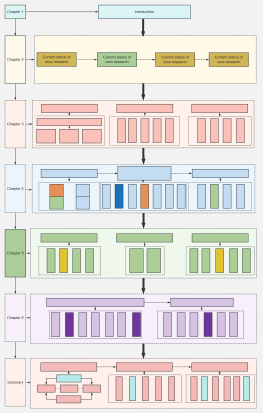
This template provides a systematic and multi-dimensional research framework for listed companies, aiming to help analysts, investors, and researchers comprehensively analyze a listed company's intrinsic value and potential risks from core dimensions such as macroeconomic background, industry trends, company fundamentals, financial quality, governance structure, and valuation levels. The template combines qualitative analysis with quantitative indicators, suitable for both long-term tracking from a value investing perspective and short-to-medium-term judgment driven by performance. Through standardized structure guidance, it ensures rigorous analytical logic, traceable data, and verifiable conclusions, avoiding fragmentation or biases from subjective judgment.
Related Recommendations
Other works by the author
Outline/Content
See more
1. The basic information layer mapping stage
Company basic profile
Listing time, place of registration, actual controller, equity structure, total share capital/tradable share capital
Company development history
Starting business, previous transformations, major mergers and acquisitions/asset restructuring
company is positioned
What sector does it belong to? Shanghai and Shenzhen Main Board/GEM/Science and Technology Innovation Board/Beijing Stock Exchange
Actual controller and management
Background of the actual controller, shareholding ratio, and whether there is equity pledge risk
Senior management team background, industry qualifications, and whether there are frequent departures
The company's dividend history, whether long-term rewards to shareholders
2. In-depth dismantling of the main business
core business segments
Business segment 1: Specific business, product/service form, application scenarios, target customers
Business segment 2: Specific business, product/service form, application scenarios, target customers
Business segment 3: Specific business, product/service form, application scenarios, target customers
Income type differentiation
Main income, other income, sideline income, investment income
Dismantling of revenue structure
Proportion of revenue and gross profit by each business segment
Regional distribution of revenue: proportion of domestic revenue/overseas revenue
customer structure
Do you rely on the top five customers? Customer concentration risk
supplier structure
Are upstream raw materials stuck? supply chain stability
Summary of business models
One sentence summarizes how the company makes money
Model differentiation: ToB enterprise, ToC enterprise, platform enterprise
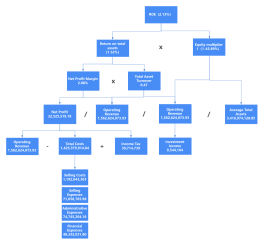
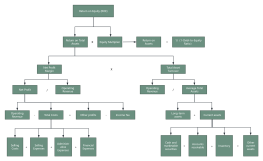
3. Financial and revenue data analysis
Revenue analysis
Year-on-year growth rate and quarter-on-quarter change in operating income in recent 3 - 5 years
Drivers of revenue growth: volume increase, price increase, production capacity expansion, mergers and acquisitions consolidation?
Profit analysis
Net profit attributable to parent and non-net profit deducted (key indicators)
Change trend of gross profit margin and net profit margin to judge product bargaining power
Asset-liability analysis
Asset-liability ratio, interest-bearing debt scale, and whether monetary funds are sufficient
Whether accounts receivable and inventory are too high (areas with high incidence of lightning)
cash flow analysis
Does net cash flow from operating activities match net profit in the long term
Poor cash flow may indicate poor profit quality
4. Analysis of core competition barriers
Technical barriers: patents, core technologies, exclusive processes, R & D moat
Resource barriers: monopoly of minerals, land, franchises, licenses and qualifications
Scale barriers: production capacity/cost advantages, scale effects
Brand barriers: industry leading brands, user stickiness, consumer mental monopoly
Channel barriers: exclusive sales channels, offline networks, binding to major customers
Barrier-free risks: Pure processing companies have limited profit margins and pressure on valuations
5. Analysis of industry tracks and industrial chains
Judgment of industry prosperity: sunrise industry/mature industry/sunset industry
Industrial chain location: upstream raw materials, midstream manufacturing, downstream applications
Industry spatial assessment
Total market size, industry growth rate in the next 3 - 5 years, penetration rate space
Industry policy impact
National support or policy restrictions, changes in industry regulatory rules
periodic attribute characterization
Classification of growth stocks, cyclical stocks, value stocks, and defense stocks
6. Comparison between industry status and the same industry
Company industry status
Global/domestic market share, industry ranking
Peer benchmarking analysis
Select 3 - 5 listed companies on the same track
Horizontal comparison: revenue, net profit, gross profit margin, valuation, R & D investment
Analysis of differentiated advantages
How is this company stronger than its peers?
Changes in market share
Has the market share increased or declined in recent years?
7. Judgment of valuation system
Commonly used valuation indicators: PE P/E ratio, PB P/B ratio, PS P/P ratio, PEG
Historical valuation quantile
The current valuation is at a high/middle/low level in the past 5 years
Horizontal valuation comparison
Compared with the valuation of companies in the same industry, is it overvalued or undervalued?
Matching between performance and valuation
Does high growth match high valuations
8. Complete review of risks
Industry risks: downturn, policy suppression, and iterative elimination of technology
Operational risks: loss of major customers, rising prices of raw materials, overcapacity
Financial risks: goodwill explosion, debt default, large impairment, cash flow rupture
Valuation risk: overvaluation of stock prices, overdrawing of future performance
Other risks: lifting the ban and reducing the holdings, accidents involving actual persons, overseas sanctions
9. Technical dismantling
Medium-and long-term trends: weekly and monthly trend positions
Chip structure: changes in the number of shareholders, chip concentration
Capital behavior: northbound capital, institutional positions, main capital flow
Key price and energy: support level and pressure level, change rule of energy and energy
X. Final comprehensive summary and investment conclusions
Core issue 1
What does this company make money? What are the core sources of income?
Core issue 2
What is the core moat and can it continue to make stable profits?
Core issue 3
Now is the right time to buy, hold or evade
Collect
Collect
Collect
Collect
Collect
Collect
Collect

0 Comments
Next Page