
General sector diagram
0 Report
A general-purpose pie chart is an information visualization tool widely used in various fields. It uses different sectors to represent the proportion of data, allowing people to intuitively understand the distribution of data. This type of chart has good visual appeal, is easy to understand, and is suitable for displaying various quantitative information.
Related Recommendations
Other works by the author
Outline/Content
See more
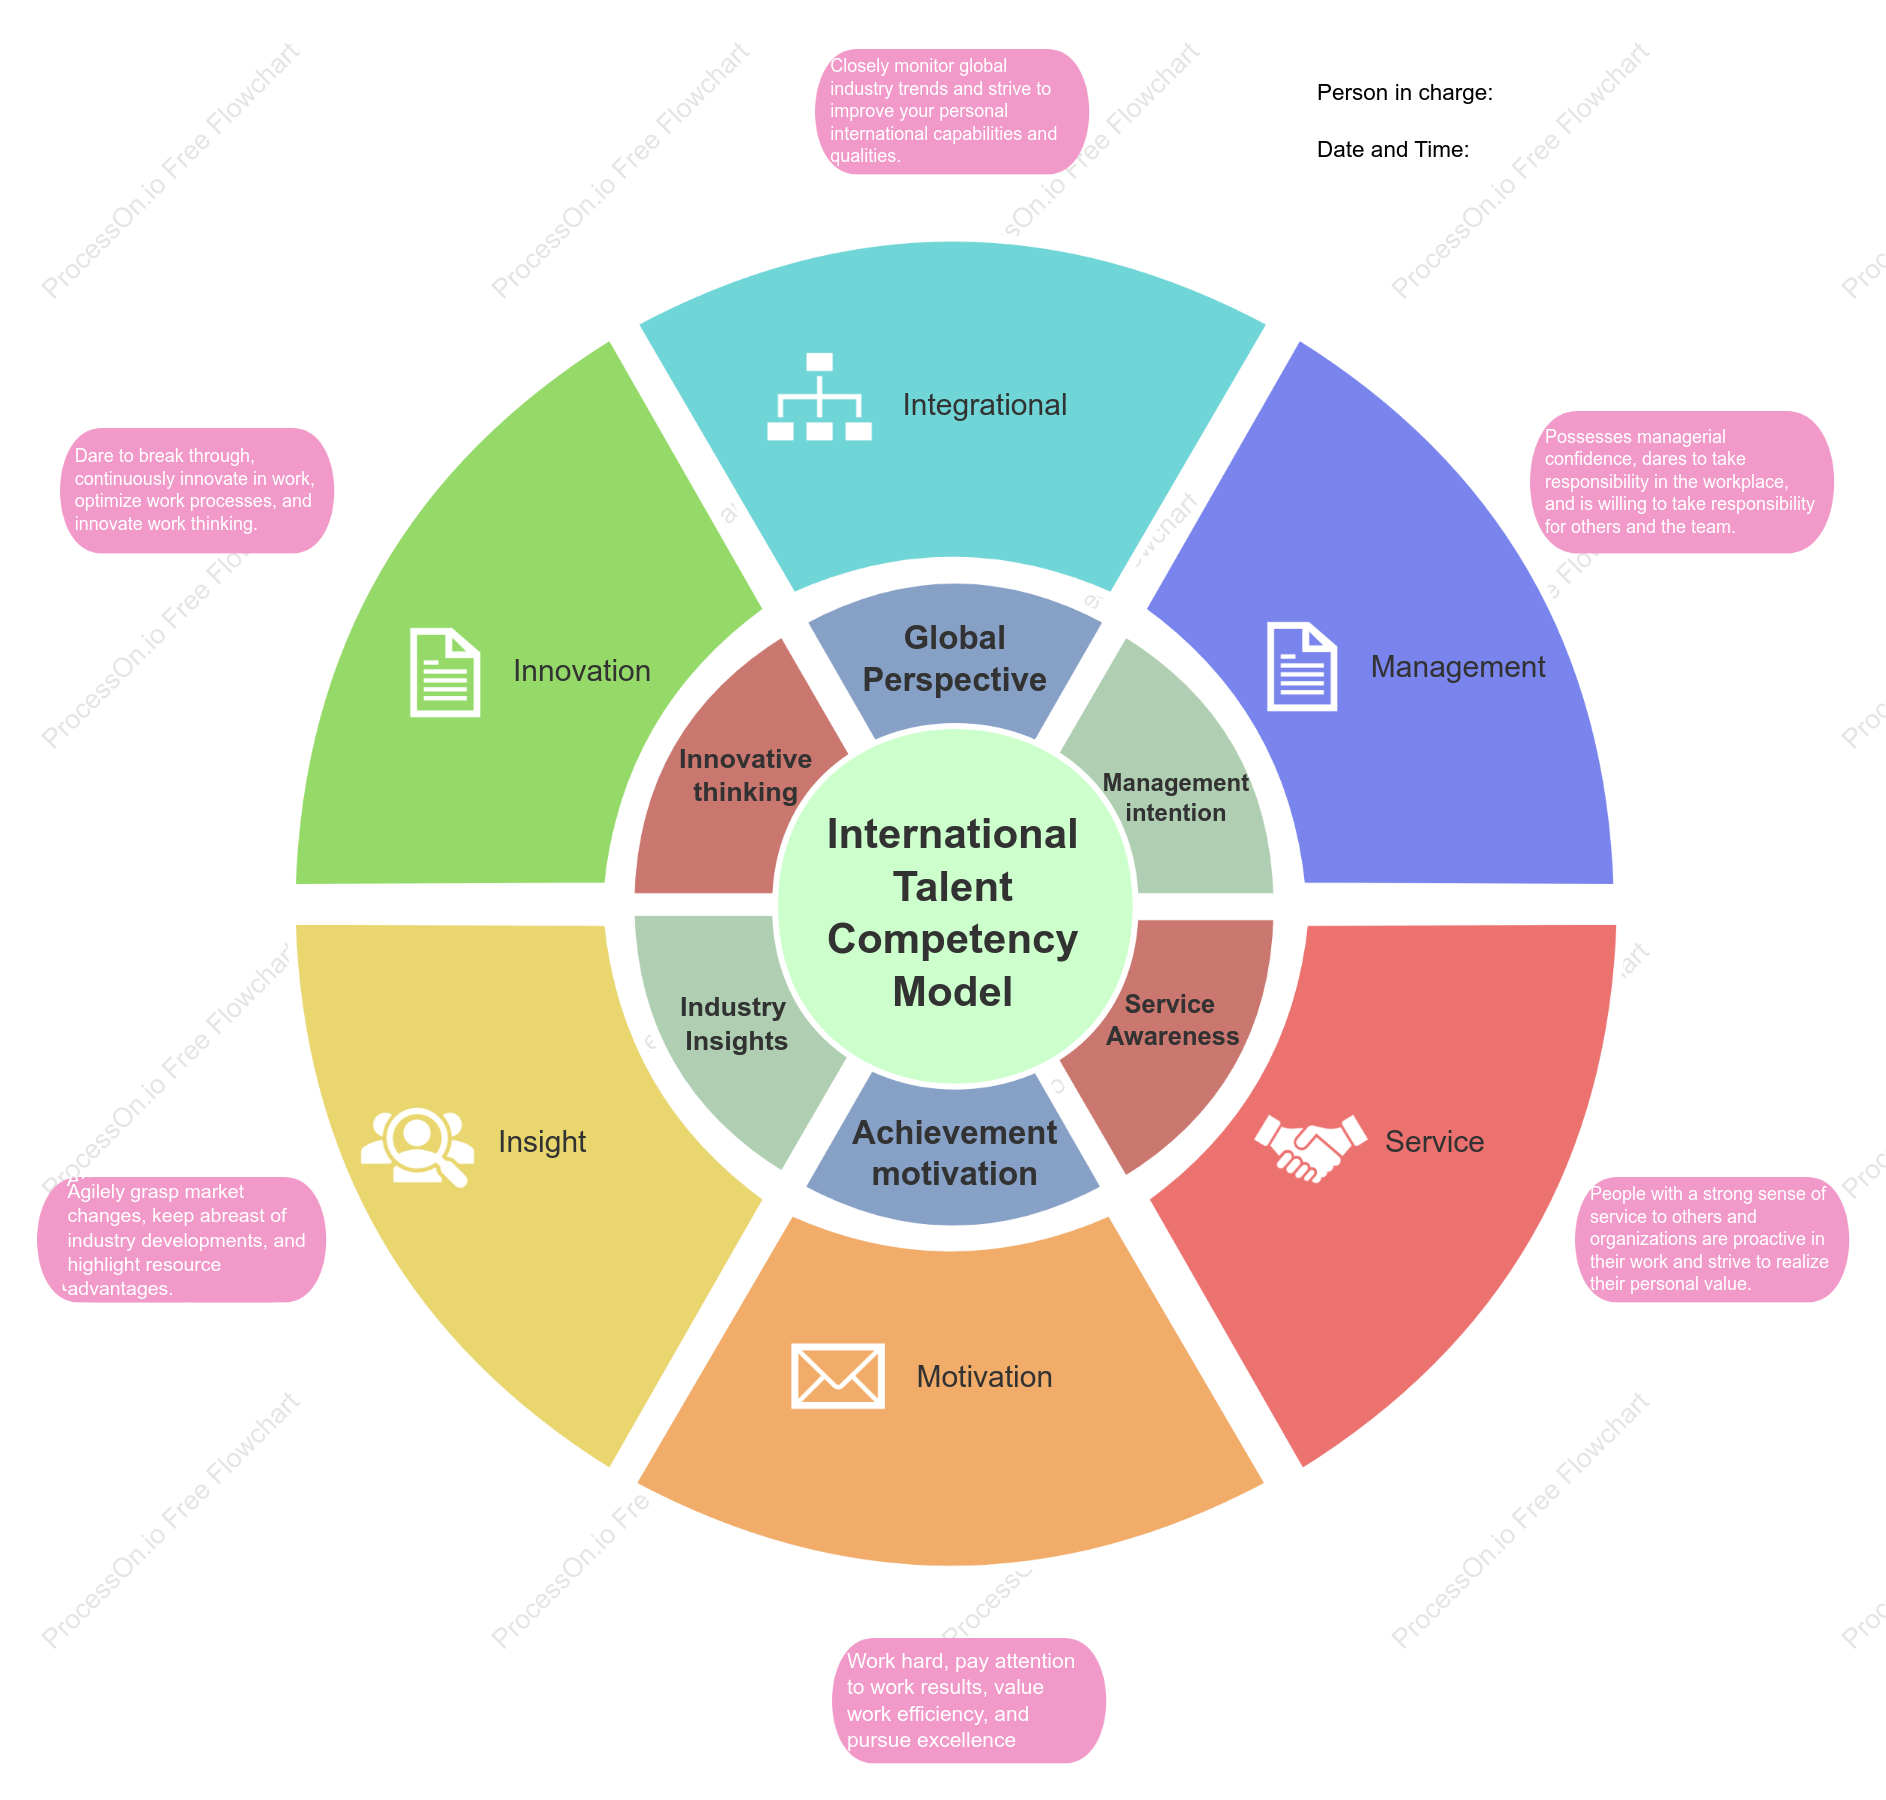
Service
Motivation
Innovative thinking
Closely monitor global industry trends and strive to improve your personal international capabilities and qualities.
Person in charge: Date and Time:
Integrational
Management
Achievement motivation
Management intention
Industry Insights
People with a strong sense of service to others and organizations are proactive in their work and strive to realize their personal value.
Insight
Innovation
International Talent Competency Model
Service Awareness
Global Perspective


Collect

0 Comments
Next Page