
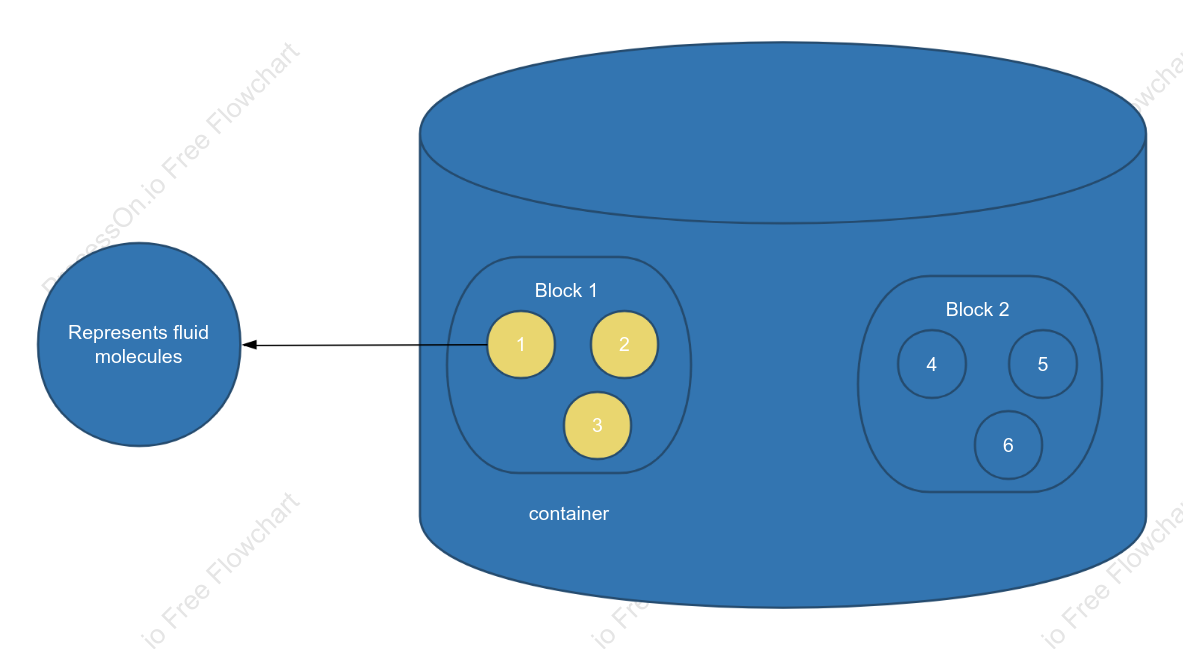

Fluid Mass Equation Analysis Diagram
0 Report
This diagram illustrates the motion of fluid elements using "Region 1," "Region 2," and numbered particles (1–6). In conjunction with the "container" boundaries, it provides a visual representation of the relationships between fluid inflow, outflow, and accumulation within a control volume, serving as the basis for deriving the mass conservation equation.
Related Recommendations
Other works by the author
Outline/Content
See more
2
Represents fluid molecules
4
Block 2
5
Block 1
6
3
container
1
Collect
Collect
Collect

Collect

Collect
Collect

0 Comments
Next Page