

fishSEM1 – Structural Equation Modeling
0 Report
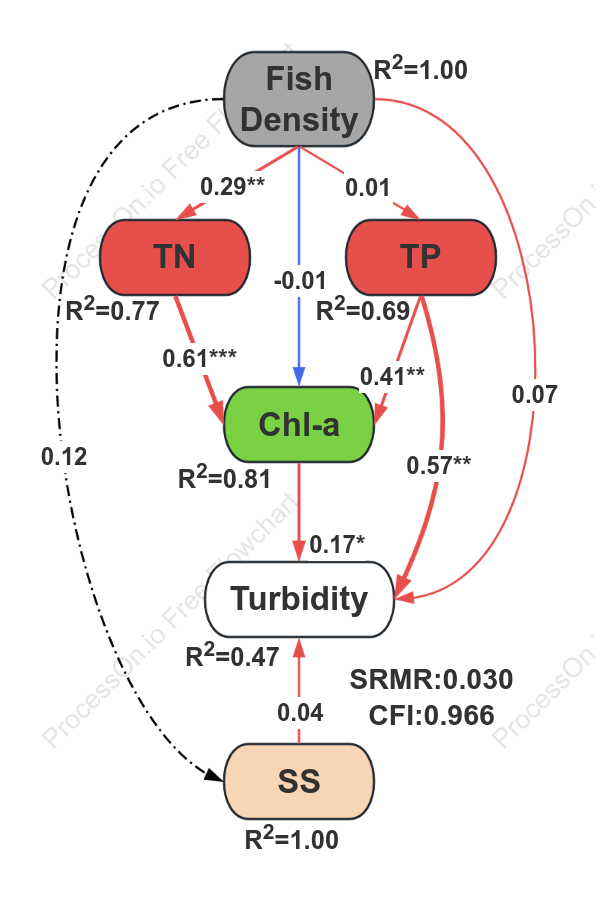
This figure illustrates the framework for analyzing fishery ecological environment factors based on structural equation modeling (SEM). The model uses fish as the core dependent variable and introduces density, total nitrogen (TN), total phosphorus (TP), chlorophyll a (Chl-a), turbidity, and suspended solids (SS) as observed variables and potential influencing factors. Path coefficients and goodness-of-fit indices are used to quantify the impact and interrelationships of each factor on fish resources. The R² values marked in the figure reflect the explanatory power of each variable on fish (Density and SS both reach 1.00, TP is 0.69, and turbidity is 0.47). The overall model fit indices SRMR=0.030 and CFI=0.966, both reaching excellent levels, indicating that the model has good fit and explanatory validity, providing data-driven quantitative decision-making basis for fishery resource assessment and water environment management.
Related Recommendations
Other works by the author
Outline/Content
See more
0.29**
0.04
TN
0.12
SRMR:0.030CFI:0.966
R2=0.47
R2=1.00
Chl-a
R2=0.77
R2=0.81
0.01
Fish Density
SS
0.41**
0.07
0.17*
0.57**
Turbidity
TP
0.61***
-0.01
R2=0.69
Collect
Collect
Collect
Collect
Collect

Collect

0 Comments
Next Page