
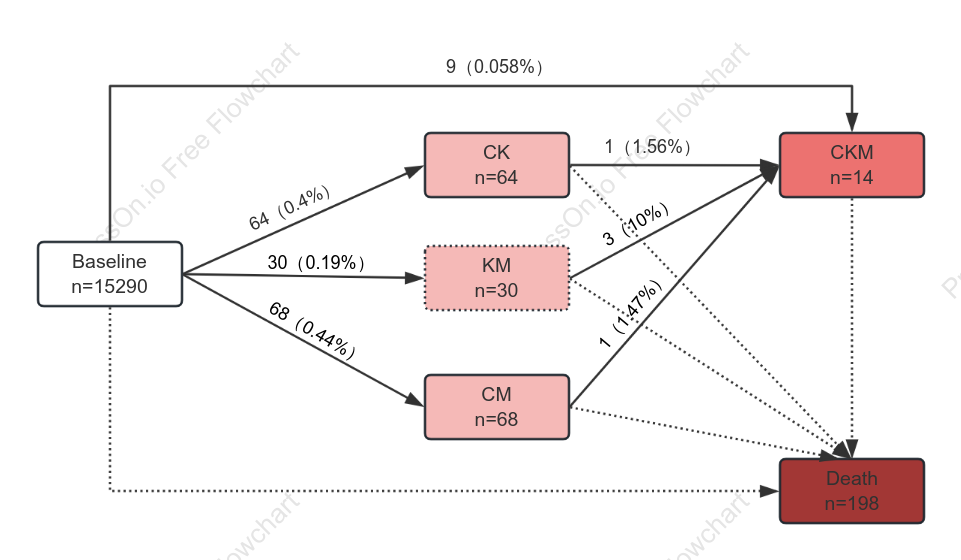

Flowchart of Participant Screening and Sample Size Statistics
0 Report
This flowchart illustrates the screening of study participants and the sample sizes for each group. A total of 15,290 cases were included at baseline; following screening, four groups were formed: CK (n=64), KM (n=30), CM (n=68), and CKM (n=14) (with some overlap between groups). Ultimately, 198 cases were included in the analysis of mortality outcomes. The figure also indicates the number of cases and the corresponding percentages at each stage of the screening process.
Related Recommendations
Other works by the author
Outline/Content
See more
CMn=68
1(1.47%)
Baselinen=15290
3(10%)
30(0.19%)
CKMn=14
KMn=30
Deathn=198
CKn=64
68(0.44%)
64(0.4%)
9(0.058%)
1(1.56%)
Collect
Collect
Collect
Collect
Collect
Collect

0 Comments
Next Page