Proseso Uri
Graphical na pagpapahayag
Nag-iisip Uri
Nakabalangkas na pagpapahayag
Mga Tala Uri
Mahusay na pagpapahayag

Propesyonal na Online na Kasangkapan sa Pag-drawing ng Funnel Chart

Libreng gamitin
Propesyonal na Online na Kasangkapan sa Pag-drawing ng Funnel Chart
Ano ang Funnel Chart

Ang funnel chart ay isang kasangkapan para sa pag-aanalisa ng proseso ng pagpapakita, na ang pinakadiwa ay ang pagpapakita ng pagbabago sa antas ng konbersyon at pagkawala sa isang multi-stage na proseso sa pamamagitan ng isang trapezoidal o hugis imbudo na grapiko na mula sa malapad hanggang makitid. Gumagana ito sa pagbabahagi ng proseso sa tuloy-tuloy na mga yugto (tulad ng pagbisita ng gumagamit → pagpaparehistro → pag-order → pagbabayad) at paggamit ng mga halaga sa bawat yugto (tulad ng dami ng gumagamit, antas ng konbersyon) upang matukoy ang lapad ng grapiko, na bumubuo ng 'malapad na pasukan, makitid na labasan' na hugis imbudo.
Sinusuportahan ng ProcessOn ang online na paglikha ng funnel charts at nag-aalok ng maraming bilang ng mga template at halimbawa ng funnel chart para sa madaling paglikha ng propesyonal at magandang tingnan na funnel charts.

Libreng gamitin

ProcessOn Funnel Chart Mga Tampok

Online Collaboration

Real-time na pakikipagtulungan ng maraming user na may shareable links para sa instant na paglipat ng impormasyon

Online Collaboration
One-Click AI Generation

Awtomatikong bumuo ng graphics mula sa text na may pagpapaganda ng estilo

One-Click AI Generation
Pagpasadya ng Estilo

Prebuilt na tema na may buong pagpasadya

Pagpasadya ng Estilo
Iba't ibang Komponente

Sinusuportahan ang mga icon, larawan, label, LaTeX formula, code block, link, attachment

Iba't ibang Komponente
Maraming Format na Suporta

I-export: PNG, VISIO, PDF, SVG | I-import: VISIO, Mermaid

Maraming Format na Suporta
Multi-Device Sync

Real-time cloud storage, multi-device sync, version history, at data security

Multi-Device Sync
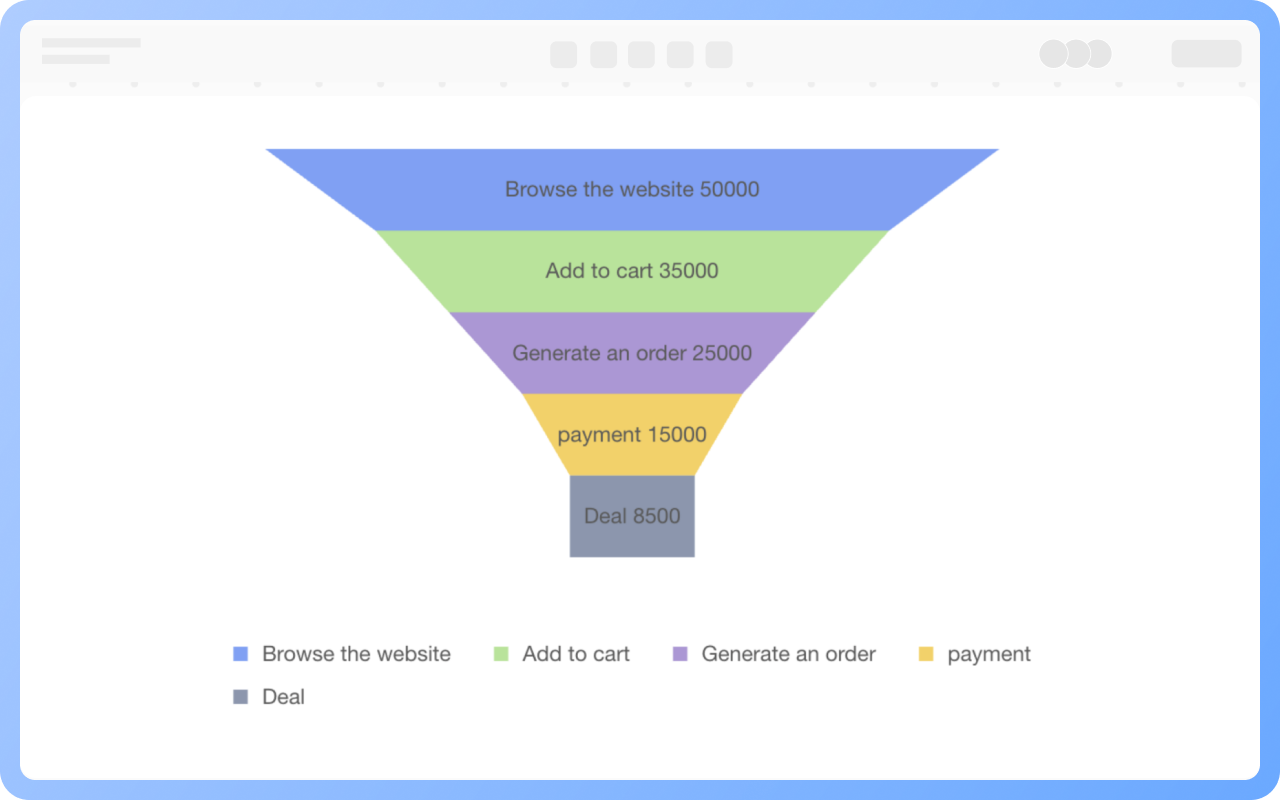
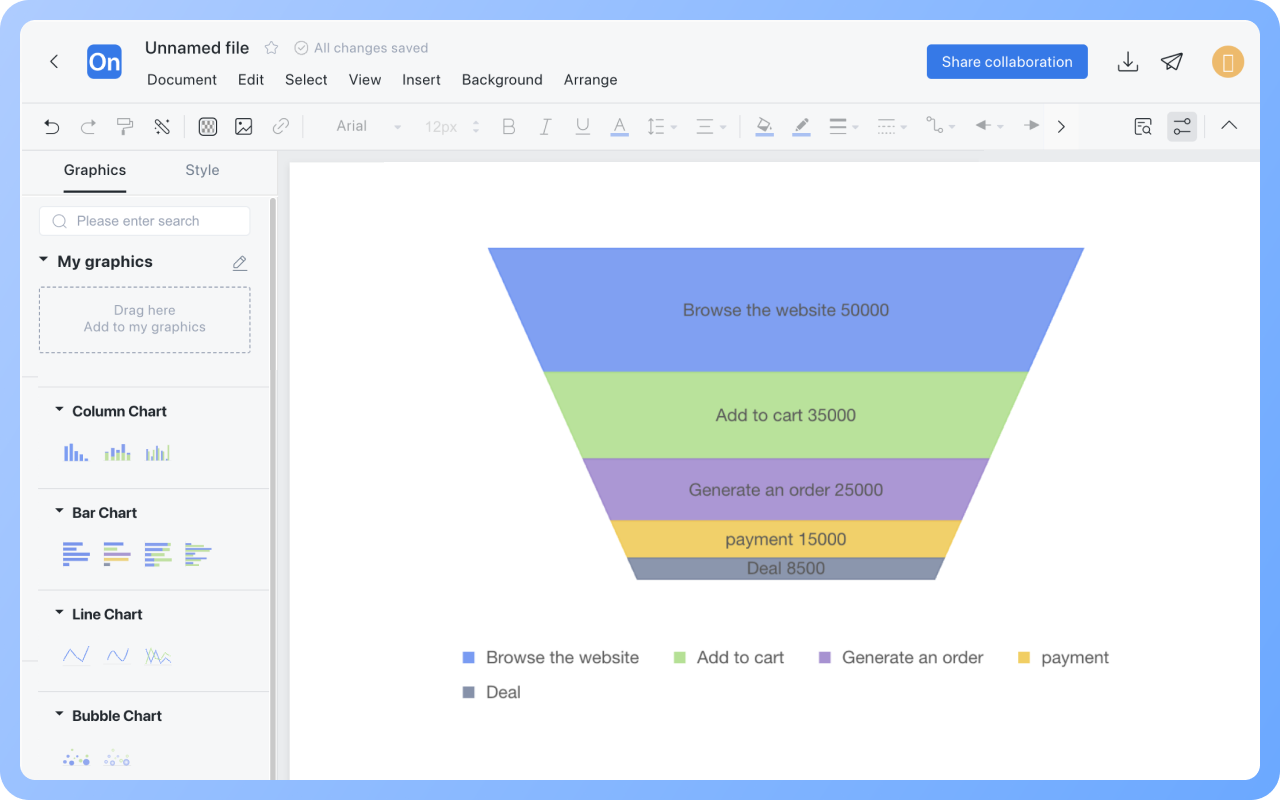
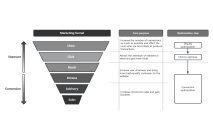
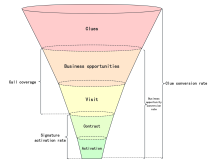
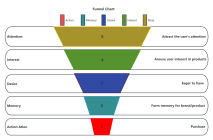
Core Logic ng Funnel Chart

The funnel chart emphasizes the sequential and diminishing nature of a process—each stage represents a critical point, and the width difference between stages directly reflects conversion efficiency. For example, if the funnel narrows sharply from 'Registered Users' to 'Ordering Users', it indicates a significant dropout issue at that stage. This design allows analysts to quickly identify bottlenecks (such as high page bounce rates, high payment failure rates) and assess optimization priorities by quantifying loss ratios (such as the decline in conversion rates).

Gumawa ng Chart Online
Core
Function ng Funnel Chart

The funnel chart transforms abstract process data into spatial awareness, enhancing sensitivity to loss through the visual 'narrowing' effect. It is particularly suitable for scenarios that require monitoring multi-step conversion efficiency (such as sales funnels, user lifecycle management, product feature usage paths), serving as an important decision basis for optimizing process design and improving resource utilization efficiency.

Gumawa ng Chart Online
Function
Pagkakaiba sa pagitan ng Funnel Chart at Pyramid Chart

The funnel chart emphasizes 'process reduction', displaying data conversion and loss in sequential steps through a shape that narrows from wide to narrow (such as decreasing customer numbers in sales funnels), suitable for identifying loss stages and optimizing conversion efficiency;
The pyramid chart focuses on 'hierarchical distribution', presenting the proportional relationship of different categories or levels in a shape that widens from narrow to wide (such as age distribution in a population pyramid), suitable for displaying structural stability or importance ranking.

Gumawa ng Chart Online
Pagkakaiba
Pinakamahuhusay na Kasanayan para sa Pagdidisenyo ng Mga Funnel Chart

1. Focus on 3-7 key stages, eliminating redundant steps (such as merging secondary steps before 'View Details' and 'Add to Cart').
2. Ensure unambiguous stage definitions (such as specifying whether 'Payment Success' means order completion or fund arrival) to avoid double counting.
3. Use contrasting colors to differentiate stages, with width strictly scaled according to data proportions, and label conversion rates/values, avoiding excessive decoration.
4. Add reference lines for industry averages or historical data to quickly locate advantage/disadvantage stages.

Gumawa ng Chart Online
Pinakamahuhusay

Funnel Chart Paano Gumuhit?

Funnel ChartPaano Gumuhit?
1
Lumikha ng bagong flowchart, at piliin ang kategoryang 'Chart' sa ilalim ng 'More Shapes' sa lugar ng hugis.
2
Piliin ang istilo ng funnel chart sa ilalim ng uri ng 'Chart' sa kaliwang bahagi ng lugar ng hugis, at i-drag ang hugis ng funnel chart sa canvas.
3
I-double click ang funnel chart, punan ang data ng chart sa kanang bahagi, at direktang maglagay ng teksto sa kahon na may dashed na linya upang magdagdag ng mga antas ng funnel.
4
I-click ang funnel chart, at ang istilo ng funnel chart ay maaaring palitan sa toolbar sa itaas.
5
I-click ang 'Download' na button sa kanang itaas na sulok upang i-export ang funnel chart bilang PNG, JPG, PDF, atbp.
Libreng gamitin

Funnel Chart Gabay sa Pagguhit

  • Learn five classic charts to make complex information clear in seconds

    Learn five classic charts to make complex information clear in seconds

    In an era of information explosion, efficiently communicating complex concepts has become a critical skill. Scatter plots , funnel plots, quadrant plots, matrix plots, and iceberg plots—five classic visualization tools—help people overcome cognitive limitations by presenting information in a structured manner. They transform abstract logic into intuitive graphics, revealing the inherent laws of a system while streamlining decision-making processes. They are widely used in fields such as business analysis, educational communication, and project management. The following systematically analyzes the core characteristics and application scenarios of each chart.
    ProcessOn-Skye
    2025-09-17
    147
  • How to make a pyramid chart? Tutorials and templates

    How to make a pyramid chart? Tutorials and templates

    In data visualization and information communication, the pyramid chart is a very effective tool. It displays information through a hierarchical structure, helping people quickly understand complex concepts or data distribution. This article will comprehensively introduce this powerful visualization tool through the concept, examples , drawing methods , templates, etc. of the pyramid chart .
    Skye
    2025-02-13
    1175
  • Comprehensive Guide to Radar Charts - Concepts, Examples, Templates

    Comprehensive Guide to Radar Charts - Concepts, Examples, Templates

    Radar chart, also known as spider chart or polar chart, is a type of chart used to display multivariate data , helping us understand and analyze complex data . It is widely used in business decision-making, financial investment, human resources and other fields. This article will give a comprehensive introduction to radar chart, including its definition, application scenarios, drawing tools, drawing methods , etc.
    Skye
    2025-02-17
    1222

Funnel Chart Rekomendasyon ng Template

Higit pang mga template

Funnel Chart Mga madalas itanong

Anong mga senaryo ang angkop para sa pagsusuri gamit ang funnel charts?

Ang mga ito ay angkop para sa pagsusuri ng mga proseso na may malinaw na pagkakasunod-sunod ng mga conversion (tulad ng mga benta, pagpaparehistro ng gumagamit, pag-click sa ad) upang matukoy ang mga punto ng pagkawala (tulad ng mataas na dropout rate mula sa 'idagdag sa cart' hanggang 'pagbabayad').

Ano ang pagkakaiba ng funnel chart at bar chart?

Ang mga funnel chart ay nagbibigay-diin sa pagbabawas ng proseso at mga rate ng conversion (ang lapad ay sumasalamin sa dami ng data), habang ang mga bar chart ay naghahambing ng mga independiyenteng halaga ng kategorya (tulad ng mga benta ng iba't ibang produkto).

Paano kinakalkula ang conversion rate ng funnel chart?

Conversion rate = bilang ng mga gumagamit sa kasalukuyang yugto ÷ bilang ng mga gumagamit sa unang yugto.

Paano magdagdag ng pamagat sa isang funnel chart?

I-drag ang 'Text' graphic mula sa 'Basic Graphics' sa kanan papunta sa itaas ng funnel chart, at i-double-click para itakda ang pamagat.

Paano magtanggal ng yugto sa isang funnel chart?

I-double-click ang funnel chart, piliin ang pangalan ng yugto o tiyak na data sa kanang menu bar, i-click ang 'Delete' button, at piliin na tanggalin ang buong hilera.

Paano itago ang ilang yugto sa isang funnel chart?

I-click ang pangalan ng legend sa ibaba ng funnel chart; kung ang legend ay naging kulay-abo, ang yugto na iyon ay itatago sa funnel chart.

Paano baguhin ang teksto, linya, at mga estilo ng graphic (font, kulay, atbp.) ng isang funnel chart?

Ang teksto, linya, at mga estilo ng graphic ng funnel charts sa ilalim ng 'Chart' na kategorya ay hindi maaaring baguhin. Maaari mong gamitin ang parihaba at iba pang mga elemento ng graphic sa ilalim ng 'Basic Graphics' upang gumuhit ng isang funnel chart, na nagpapahintulot sa mga pagbabago sa teksto, linya, at mga estilo ng graphic.

Paano i-export ang isang funnel chart sa imahe o PDF format?

I-click ang 'Download' button sa kanang itaas na sulok upang i-export ang funnel chart bilang PNG, JPG, PDF, atbp.

Mga Kaugnay na Graph