
Sales Process Funnel Chart
0 Report
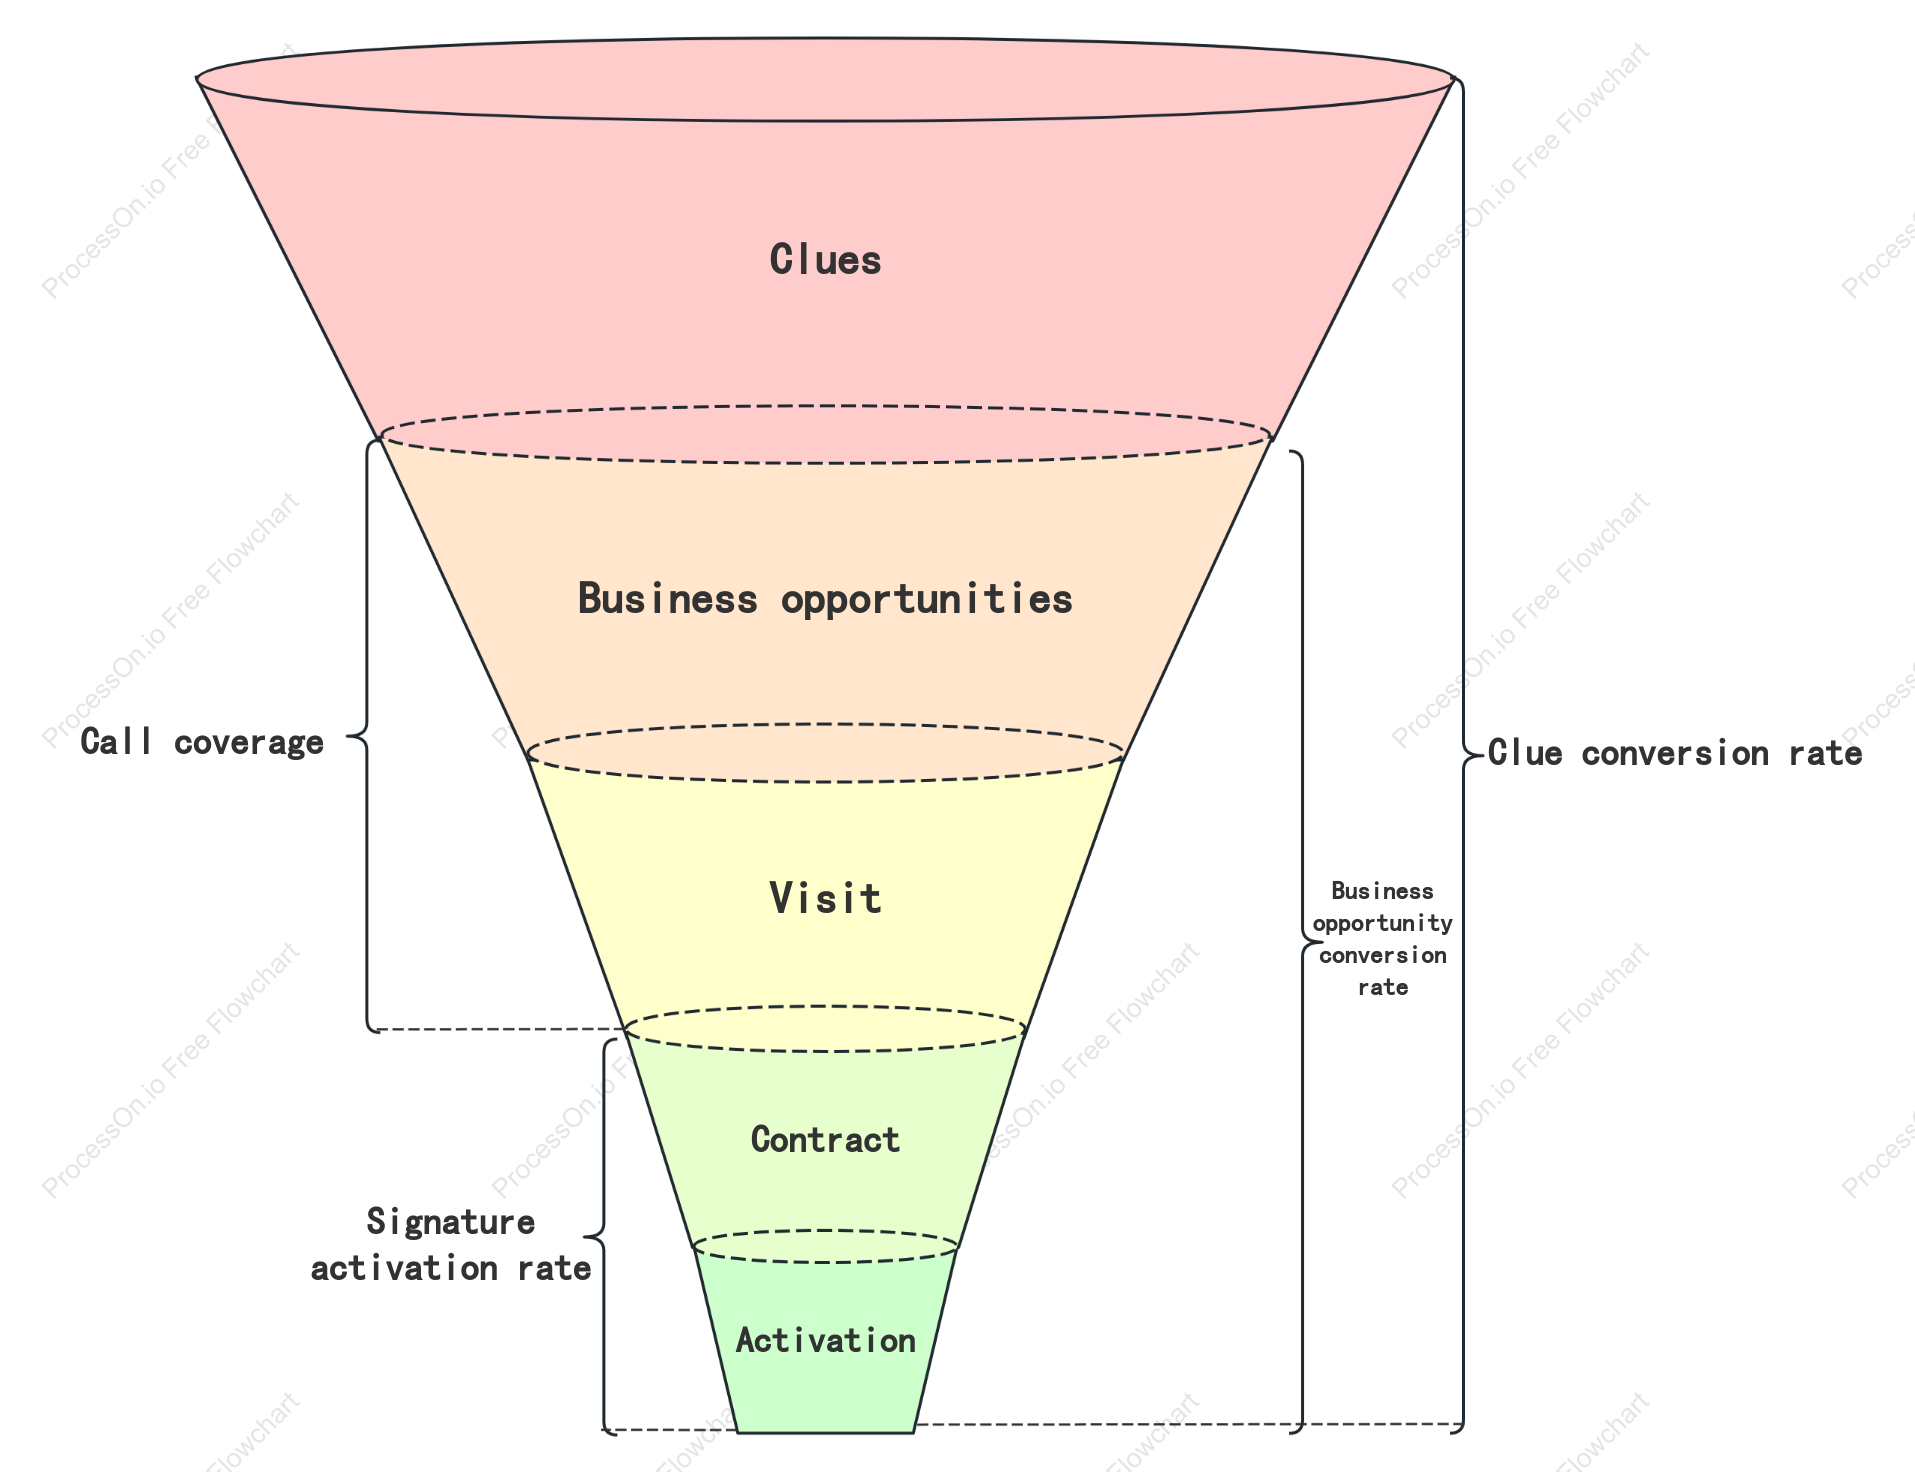
The Sales Process Funnel Chart provides a comprehensive overview of the key stages in the sales journey, highlighting critical metrics such as clue conversion rate, business opportunity conversion rate, and signature activation rate. It outlines the progression from initial clues to business opportunities, visits, activation, and ultimately, contract finalization. The chart emphasizes the importance of call coverage in maintaining engagement and moving prospects through the funnel efficiently. This structured approach is designed to optimize each stage of the sales process, ensuring higher conversion rates and successful contract completions.
Related Recommendations
Other works by the author
Outline/Content
See more
Clue conversion rate
Business opportunity conversion rate
Business opportunities
Visit
Clues
Signature activation rate
Activation
Contract
Call coverage


Collect
Collect
Collect

0 Comments
Next Page