
Compound pie chart template - product sales
1 Report
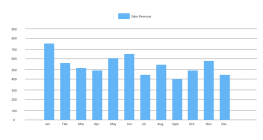
This compound pie chart template provides a visual representation of product sales revenue by region for the year 2025. It highlights the dominant sales contribution from Region B at 55%, followed by Area F at 70%. Other significant regions include Region E at 14%, Region D at 16%, Region A at 15%, and Region C at 17%. This chart offers a clear and concise overview of how different regions contribute to the overall sales revenue, providing valuable insights for strategic planning and decision-making in the sales department.
Related Recommendations
Other works by the author
Outline/Content
See more
Region B55%
Area F70%
Pie chart of product sales revenue by region in 2025
Region E14%
Region D16%
Region A15%
Region C17%
Others13%
Collect
Collect
Collect
Collect
Collect
Collect
Collect
Collect

0 Comments
Next Page