
Stacked column chart template
0 Report
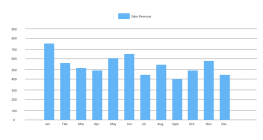
This is a stacked column chart template designed to analyze product qualification across various company product categories. The chart provides a visual representation of qualified and disqualified products within categories such as A, B, C, D, E, F, G, H, and J. By illustrating the proportion of qualified products against the disqualified ones, this chart serves as a valuable tool for understanding product performance and making informed decisions. It is particularly useful for companies looking to optimize their product offerings and improve overall quality standards.
Related Recommendations
Other works by the author
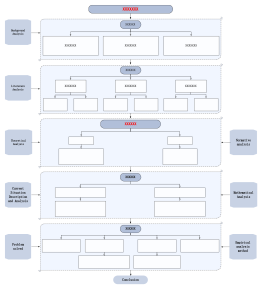
Outline/Content
See more
60
Category E
Sitaxisaxislabeltitle
100
Qualified
Analysis chart of product qualification for various types of company products
Category B
Category F
80
Category A
0
Category G
Category H
Category J
Category C
Disqualified
20
Category D
40
Collect
Collect
Collect
Collect
Collect
Collect
Collect

0 Comments
Next Page