Venn diagram
0 Report
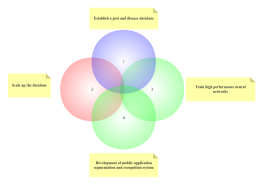
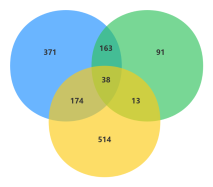
This Venn diagram is designed to illustrate the overlapping and distinct elements within a dataset, represented here by the recurring numerical sequence '1232' and a unique entry '1123.' The diagram is a visual tool to help identify commonalities and differences between these data points, offering insights into their relationships. By examining the intersections and exclusivities, users can better understand the distribution and interaction of these numbers. This visualization is intended to aid in data analysis, providing a clear and concise representation of the dataset's structure and underlying patterns.
Related Recommendations
Other works by the author
Outline/Content
See more
1232
1123

Collect

Collect

Collect

0 Comments
Next Page


