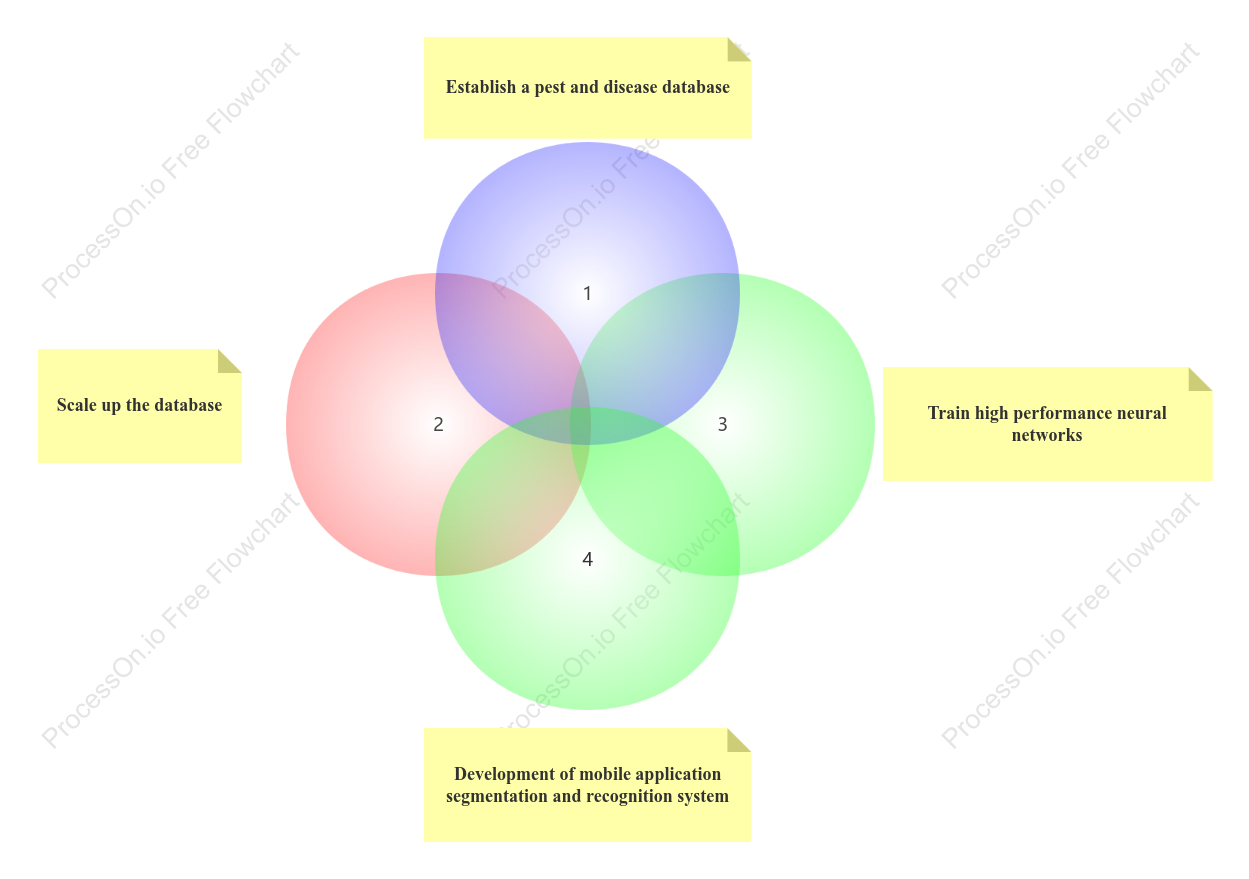

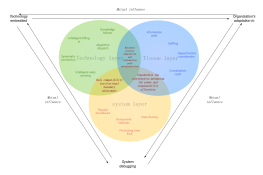
Research method Venn diagram
5 Report
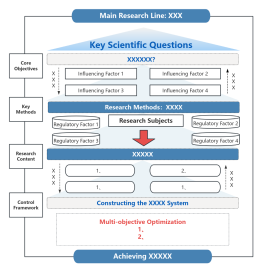
This flowchart, titled 'Research Method Venn Diagram,' outlines a structured approach to developing a comprehensive pest and disease database. It illustrates the sequential steps involved, beginning with the establishment of the database and progressing through the development of a mobile application for segmentation and recognition. The process includes training high-performance neural networks to enhance system accuracy. Finally, the chart highlights the importance of scaling up the database to ensure robustness and reliability. This diagram serves as a guide for researchers aiming to create an efficient and scalable solution for pest and disease management.
Related Recommendations
Other works by the author
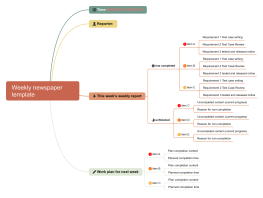
Outline/Content
See more
Establish a pest and disease database
3
2
1
Development of mobile application segmentation and recognition system
Train high performance neural networks
4
Scale up the database
Collect
Collect
Collect
Collect
Collect

0 Comments
Next Page