
Timeline of project implementation process
0 Report
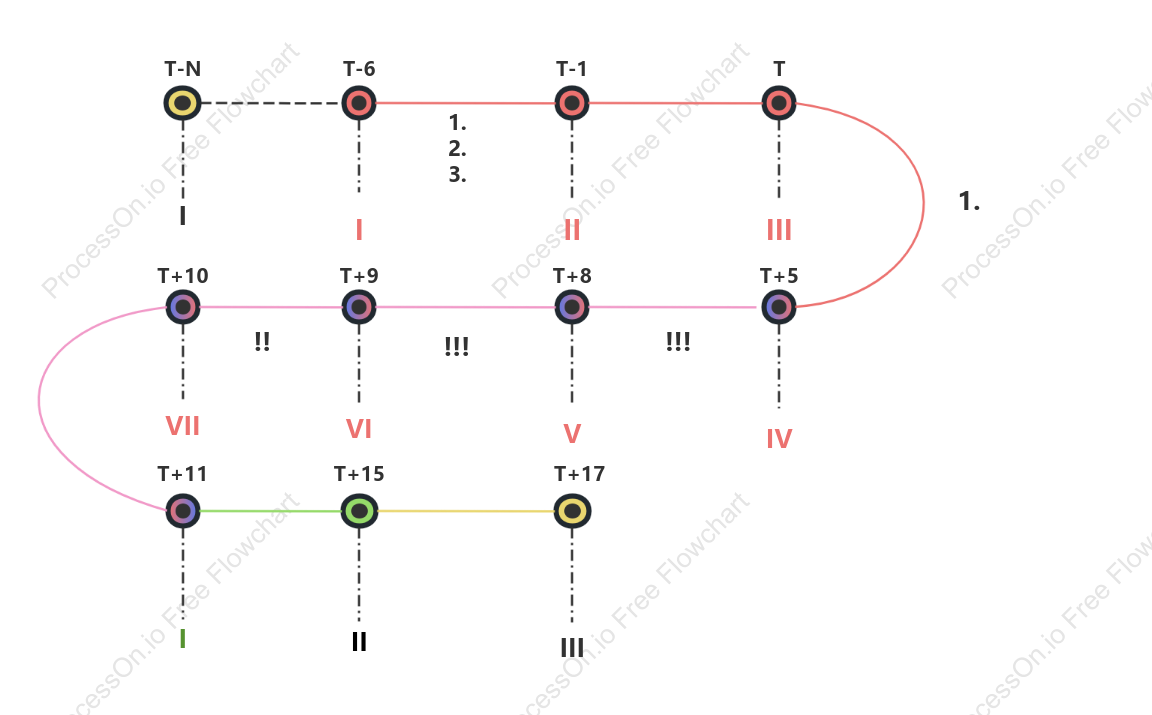
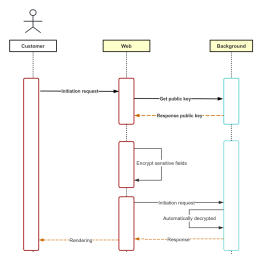
This flowchart, titled 'Timeline of Project Implementation Process,' outlines the sequential steps and phases involved in executing a project. It highlights key milestones and tasks, represented by codes such as T+10, T-N, and T+15, which indicate specific timelines and actions. The chart also identifies various stages and components, denoted by Roman numerals and symbols, to guide project managers through the implementation. Each element corresponds to a critical part of the process, ensuring clarity and efficiency in project execution. This visual representation aims to facilitate a structured and systematic approach to project management.
Related Recommendations
Other works by the author
Outline/Content
See more
T+10
T-N
T+11
1. 2. 3.
IV
T+17
I
T+15
!!!
III
T+8
T+9
VI
VII
II
T-6
T-1
T
1.
!!
T+5
V


Collect
Collect
Collect
Collect

0 Comments
Next Page