
Fishbone diagram: User anomaly analysis chart
0 Report
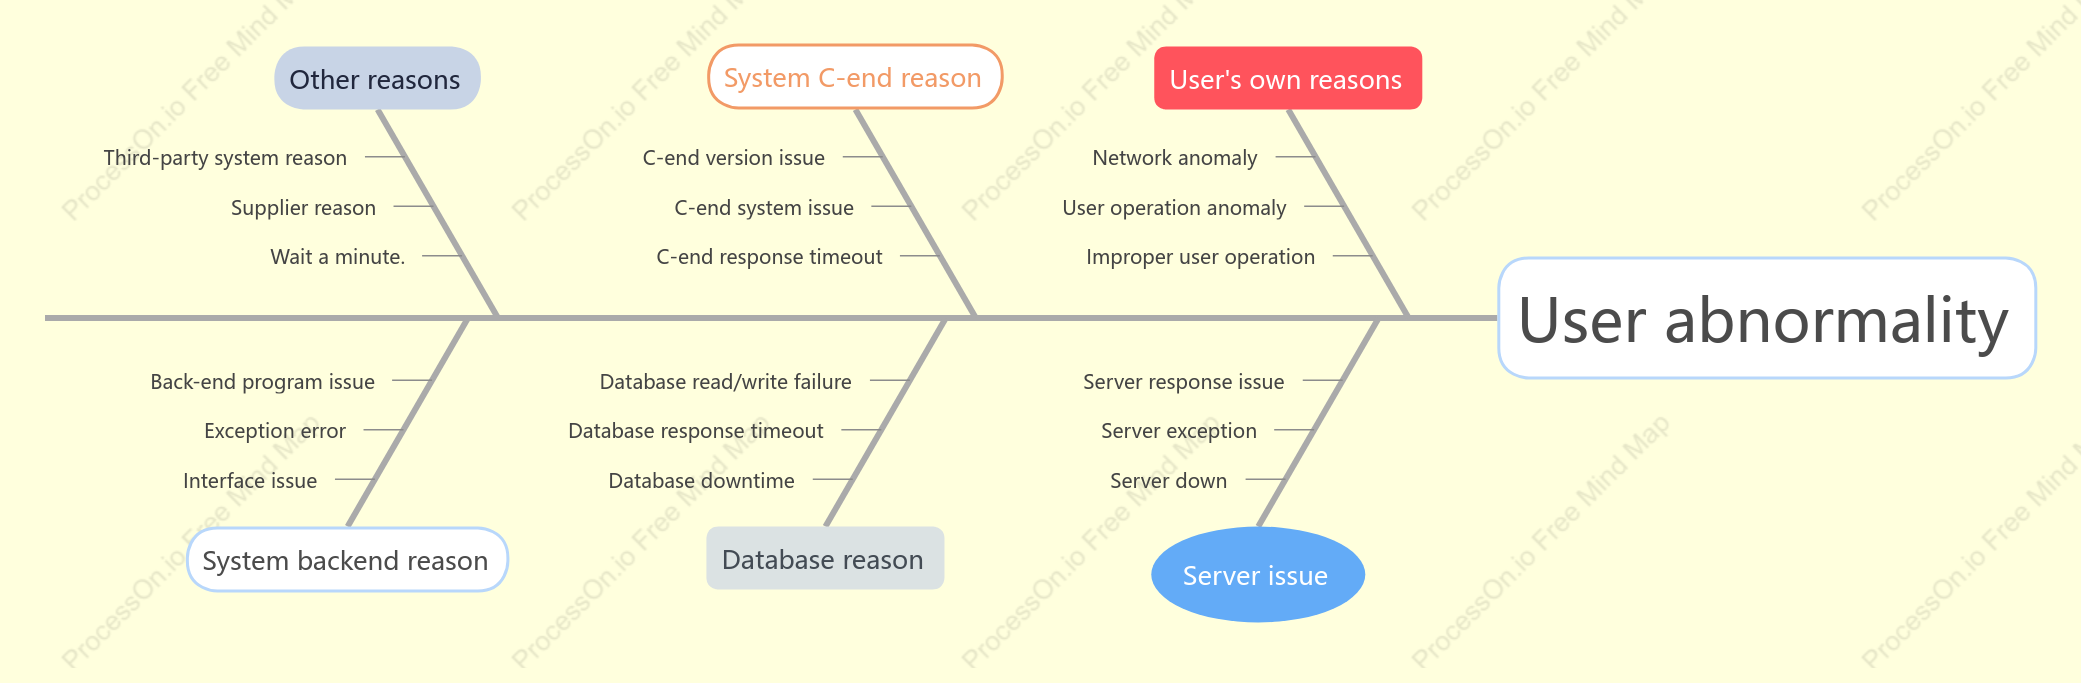
The 'Fishbone Diagram: User Anomaly Analysis Chart' provides a structured approach to identifying and categorizing potential causes of user abnormalities. This comprehensive mind map delineates various factors contributing to user anomalies, including issues stemming from the user's own actions, such as network and operational anomalies. It also examines server-related problems, highlighting instances of server downtime and response issues. Additionally, the chart explores C-end system challenges, database failures, and other external factors like third-party and supplier-related issues. By systematically organizing these potential causes, the diagram serves as a valuable tool for diagnosing and resolving user anomalies efficiently.
Related Recommendations
Other works by the author
Outline/Content
See more
User's own reasons
Network anomaly
User operation anomaly
Improper user operation
Server issue
Server down
Server exception
Server response issue
System C-end reason
C-end version issue
C-end system issue
C-end response timeout
Database reason
Database downtime
Database response timeout
Database read/write failure
Other reasons
Third-party system reason
Supplier reason
Wait a minute.
System backend reason
Interface issue
Exception error
Back-end program issue


Collect
Collect
Collect

0 Comments
Next Page