
Fishbone diagram (cause and effect diagram) template
1 Report
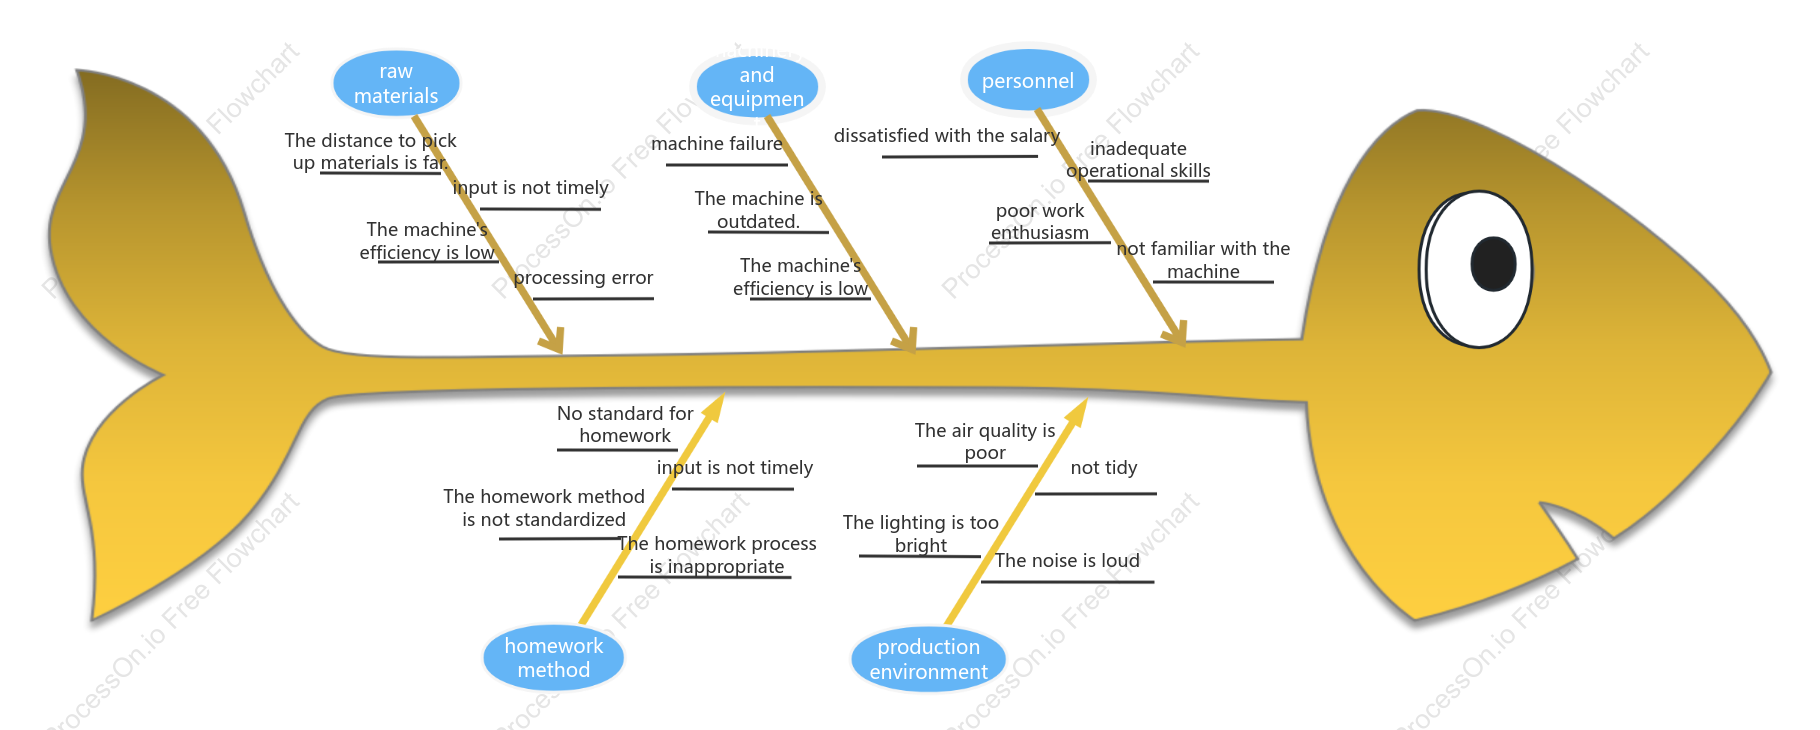
This Fishbone diagram, also known as a cause and effect diagram, is a valuable tool for identifying potential factors leading to inefficiencies in a production process. It highlights various issues such as untimely input, poor air quality, inappropriate homework processes, and low machine efficiency. Other contributing factors include outdated machinery, inadequate operational skills, and dissatisfaction with salary. By examining these elements, the diagram aids in pinpointing root causes of errors and inefficiencies, such as processing errors and machine failures, ultimately guiding improvements in the production environment and enhancing overall productivity.
Related Recommendations
Other works by the author
Outline/Content
See more
input is not timely
not tidy
The air quality is poor
The homework process is inappropriate
not familiar with the machine
The homework method is not standardized
The machine's efficiency is low
machine failure
poor work enthusiasm
No standard for homework
production environment
processing error
personnel
The noise is loud
dissatisfied with the salary
inadequate operational skills
machinery and equipment
The distance to pick up materials is far.
homework method
The machine is outdated.
The lighting is too bright
raw materials


Collect

0 Comments
Next Page