
Final project_correlation statistical use case diagram
1 Report
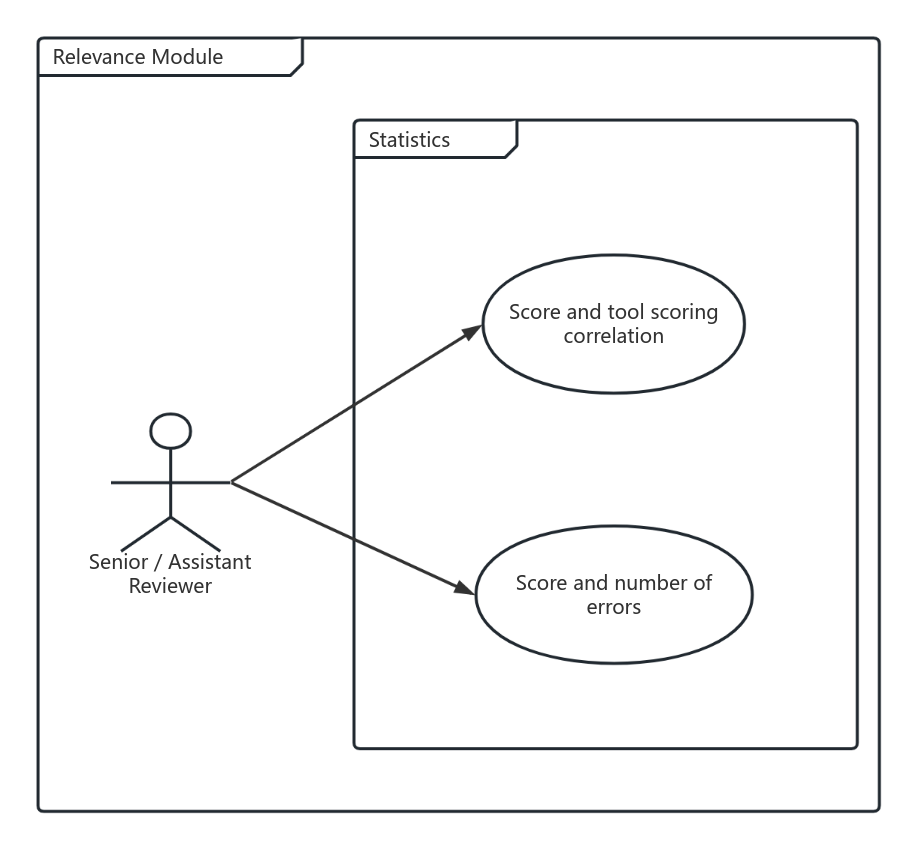
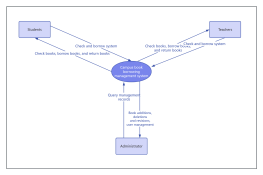
The 'Final Project_Correlation Statistical Use Case Diagram' presents a structured overview of the processes involved in assessing statistical correlations within a project framework. Key elements include the Relevance Module, which evaluates the pertinence of data, and metrics such as score and number of errors, providing insights into data quality. Additionally, the diagram highlights the correlation between scores and tool scoring, underpinned by statistical analysis. The roles of Senior and Assistant Reviewers are also delineated, emphasizing their contributions to ensuring accuracy and reliability in the evaluation process. This comprehensive diagram serves as a guide for effectively managing statistical assessments.
Related Recommendations
Other works by the author
Outline/Content
See more
Relevance Module
Score and number of errors
Score and tool scoring correlation
Statistics
Senior / Assistant Reviewer


Collect

0 Comments
Next Page