
Essential flowcharts for SCI (Science Citation Index)
1 Report
This template is specifically designed for SCI paper writing and academic research scenarios. It is suitable for illustrating the execution flow of research methods, the specific steps of experimental design, data collection and processing paths, or the literature selection logic for systematic reviews. Through a standardized academic flowchart structure, it clearly demonstrates the complete technical route of research from "proposing a question" to "drawing conclusions." The use of simple geometric shapes (rectangles, rhombuses, arrows) and grayscale color schemes is recommended to meet the SCI journal's submission requirements for clear, standardized, and highly editable figures and tables. It is suitable for use as illustrations in the main text of papers, supplementary materials, academic presentations, or project proposals.
Related Recommendations
Other works by the author
Outline/Content
See more
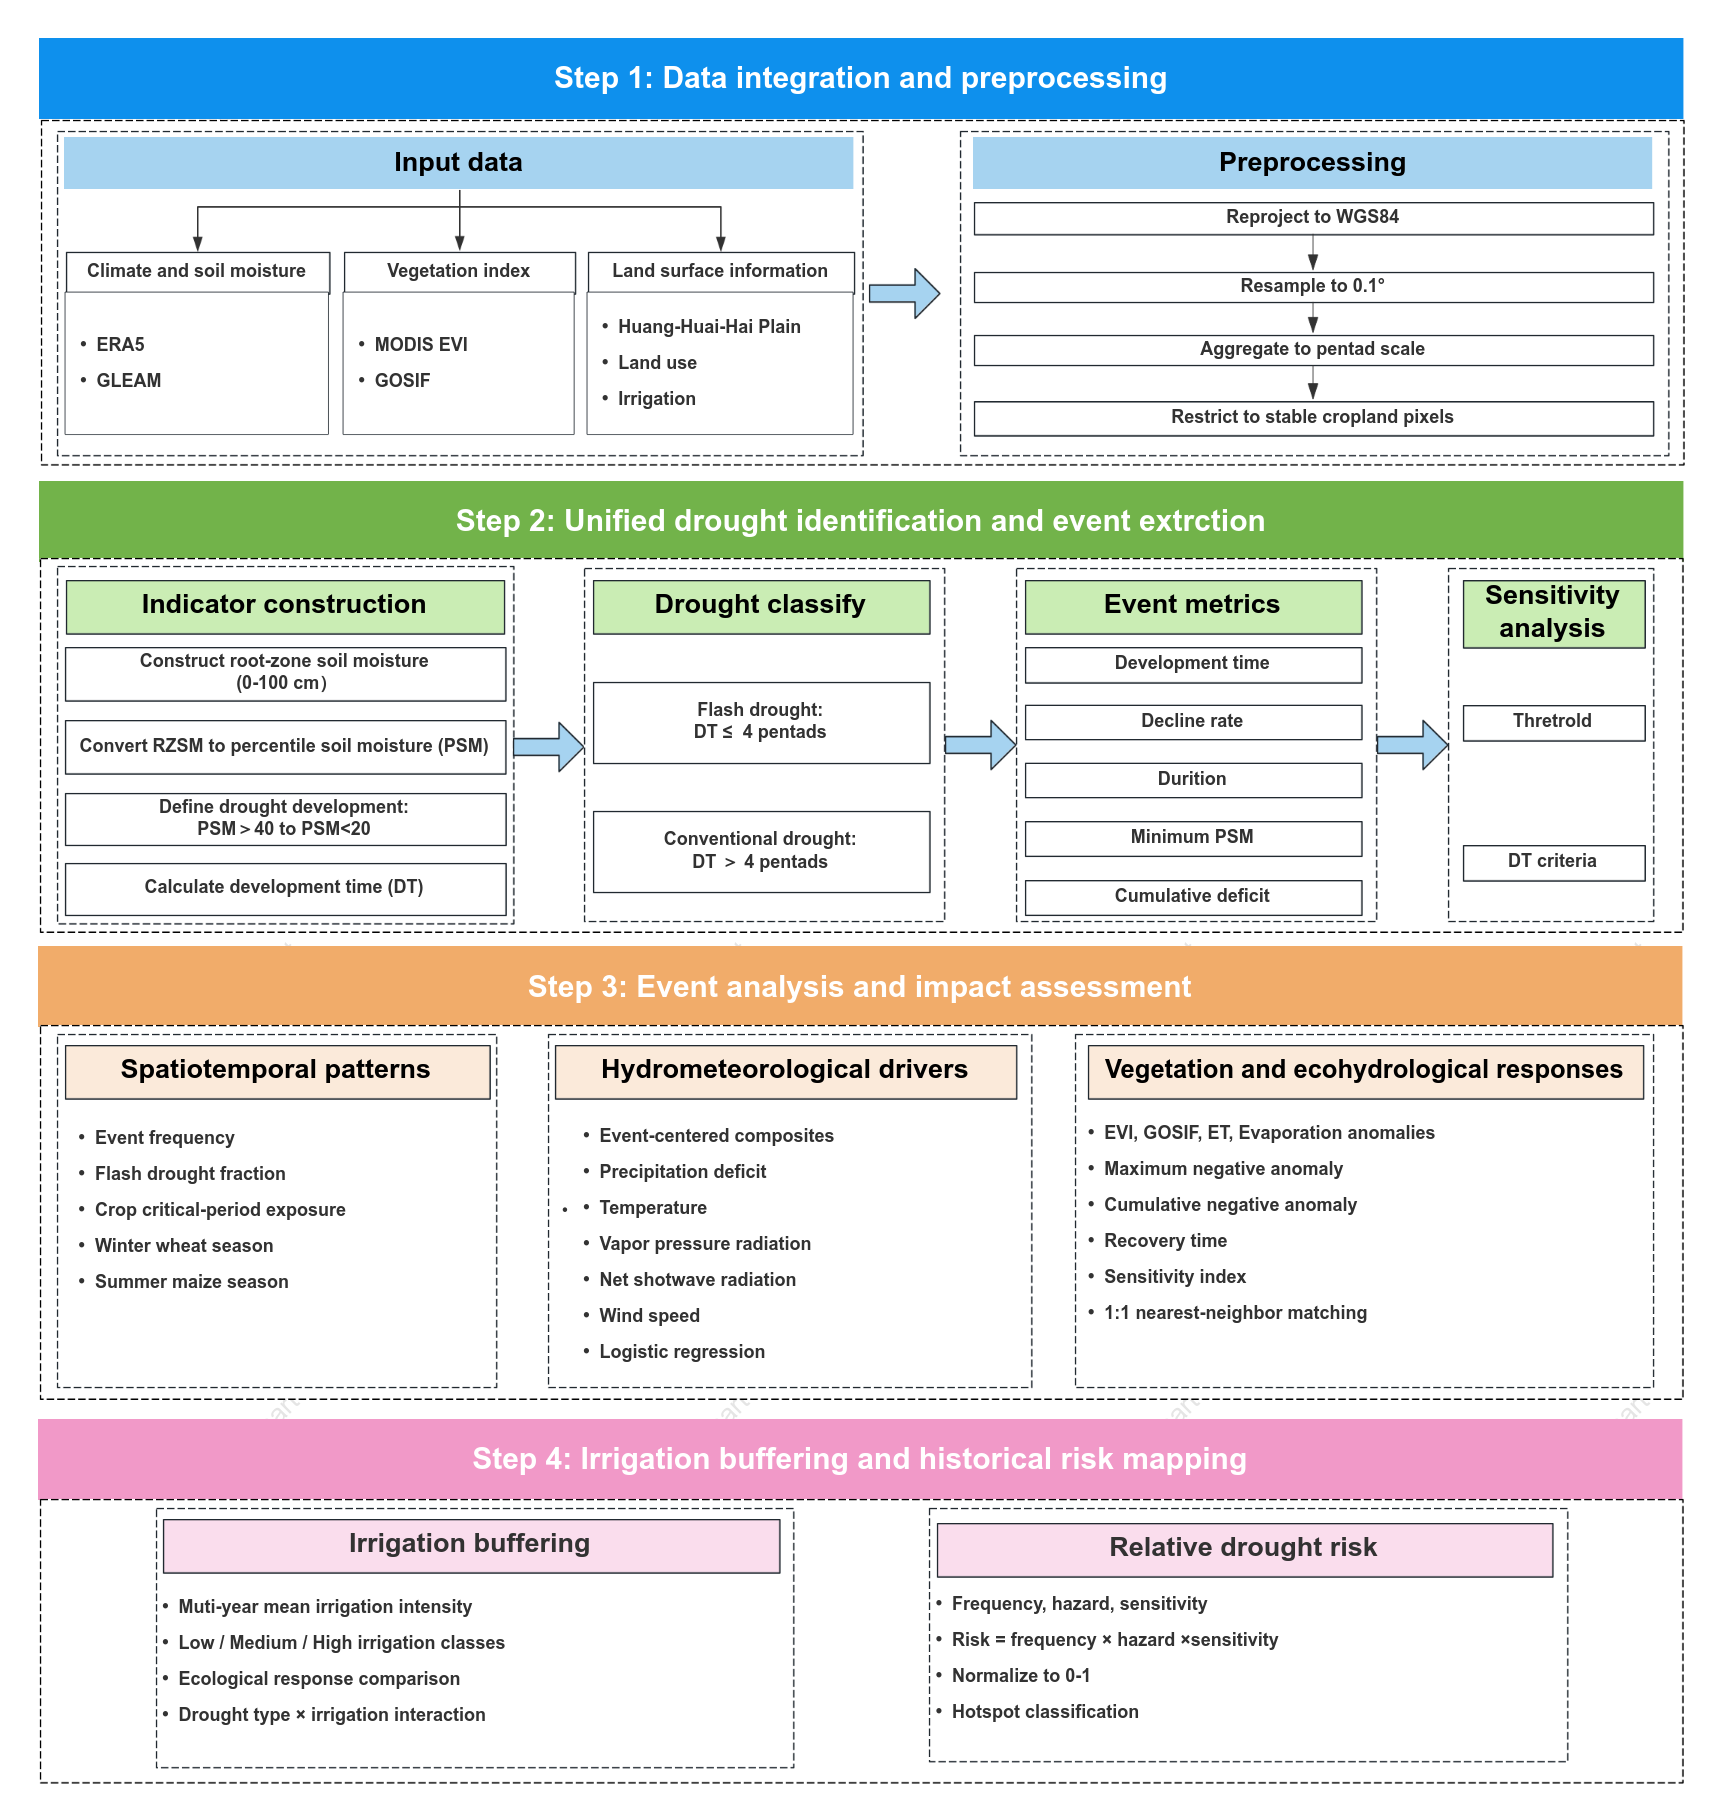
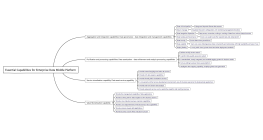
Indicator construction
Define drought development:PSM>40 to PSM<20
Resample to 0.1°
Restrict to stable cropland pixels
Irrigation buffering
Step 3: Event analysis and impact assessment
Hydrometeorological drivers
Construct root-zone soil moisture (0-100 cm)
Vegetation and ecohydrological responses
Reproject to WGS84
Event metrics
Step 2: Unified drought identification and event extrction
Input data
Convert RZSM to percentile soil moisture (PSM)
Muti-year mean irrigation intensityLow / Medium / High irrigation classesEcological response comparisonDrought type × irrigation interaction
Climate and soil moisture
Thretrold
Event frequencyFlash drought fractionCrop critical-period exposureWinter wheat seasonSummer maize season
Step 1: Data integration and preprocessing
Preprocessing
Vegetation index
Spatiotemporal patterns
Huang-Huai-Hai PlainLand useIrrigation
DT criteria
Flash drought:DT ≤ 4 pentads
Aggregate to pentad scale
ERA5GLEAM
MODIS EVIGOSIF
Relative drought risk
Durition
Decline rate
Sensitivity analysis
Conventional drought:DT > 4 pentads
Minimum PSM
Cumulative deficit
Drought classify
Development time
Calculate development time (DT)
Land surface information
Step 4: Irrigation buffering and historical risk mapping
Event-centered compositesPrecipitation deficitTemperatureVapor pressure radiationNet shotwave radiationWind speedLogistic regression


Collect

0 Comments
Next Page