
E-R Diagram Drawing
2 Report
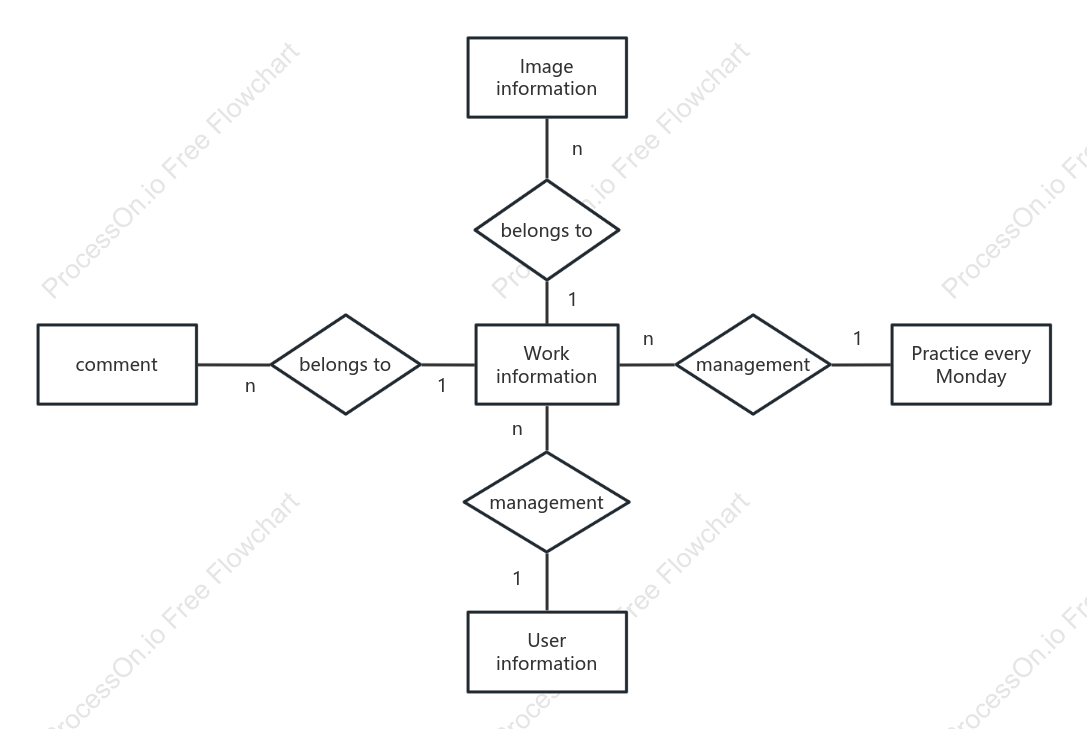
This E-R Diagram Drawing flowchart illustrates the relationships and management processes involving image, user, and work information. It highlights the connections where image information belongs to user information, which in turn is associated with management. Additionally, work information is also under management, with a practice scheduled every Monday. The diagram further includes a commenting feature, allowing for interaction and feedback. This structured representation aims to provide a clear understanding of the data relationships and management practices within the system.
Related Recommendations
Other works by the author
Outline/Content
See more
n
1
Image information
belongs to
User information
management
Work information
Practice every Monday
comment


Collect

0 Comments
Next Page