
Bubble Chart Classification
0 Report
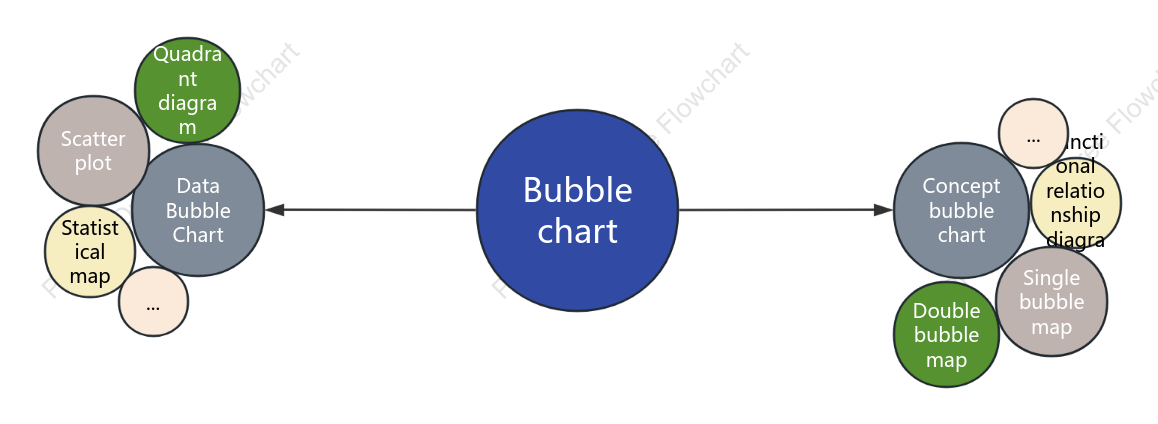
This is a Bubble Chart Classification guide, designed to categorize various types of bubble charts and their applications. The flowchart includes different chart types such as quadrant diagrams, single and double bubble maps, scatter plots, and statistical maps. It illustrates functional relationships and concept bubble charts, providing a comprehensive overview of how data can be visually represented through these methods. This guide aims to assist users in understanding and selecting the appropriate bubble chart for their specific data visualization needs.
Related Recommendations
Other works by the author
Outline/Content
See more
Quadrant diagram
Single bubble map
Scatter plot
Functional relationship diagram
Concept bubble chart
Bubble chart
Double bubble map
...
Statistical map
Data Bubble Chart


Collect


0 Comments
Next Page