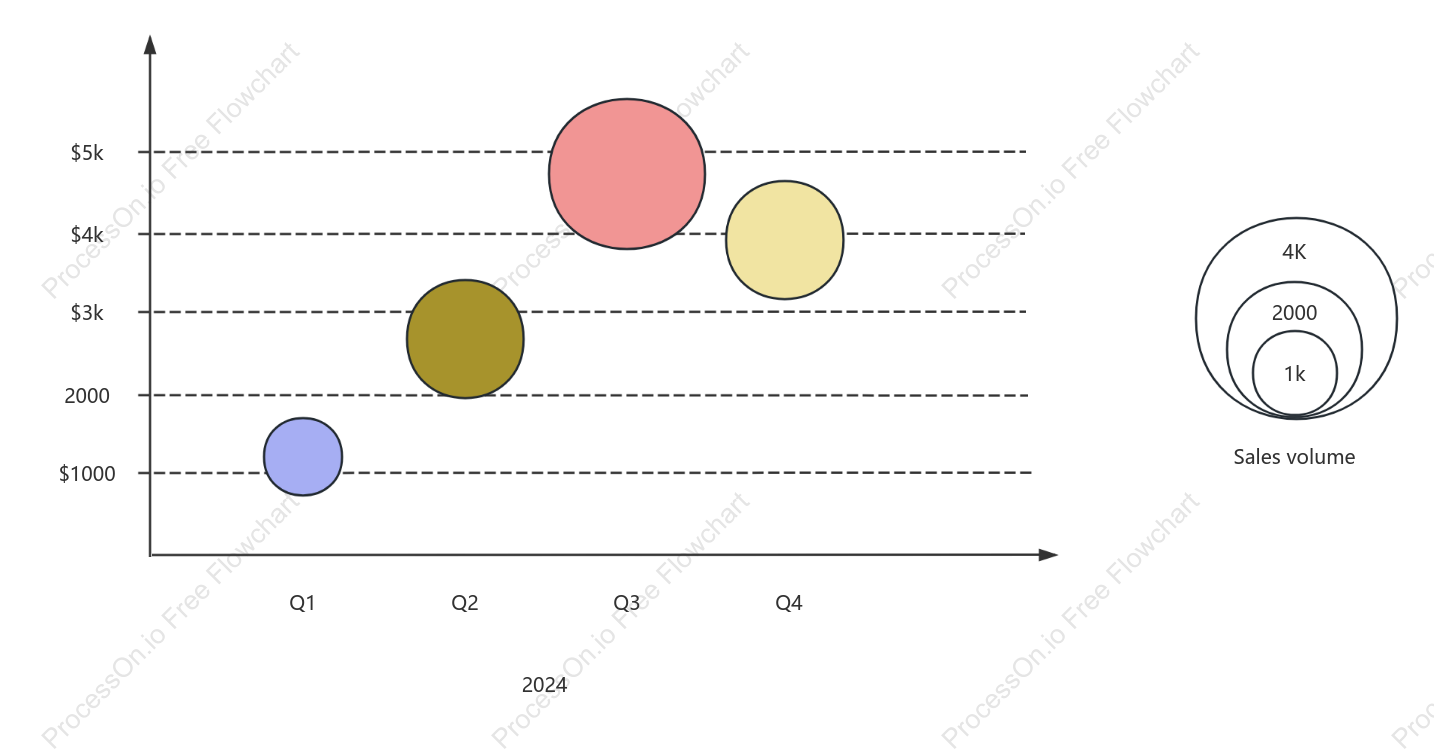

Advertising Spending-Sales Bubble Chart
0 Report
The 'Advertising Spending-Sales Bubble Chart' provides a visual representation of the relationship between advertising expenditure and sales volume across different quarters. It highlights sales data for Q1 through Q4, with specific monetary benchmarks such as $1k, $3k, $4k, and $5k. The chart also includes data points for the years 2000 and 2024, offering a comparative analysis over time. This bubble chart serves as a valuable tool for understanding how advertising spending correlates with sales performance, helping businesses make informed decisions about their marketing strategies.
Related Recommendations
Other works by the author
Outline/Content
See more
Sales volume
Q4
Q1
$4k
Q2
Q3
$5k
2000
2024
4K
$1000
$3k
1k
Collect

Collect
Collect

0 Comments
Next Page