
Column chart template - Business style
0 Report
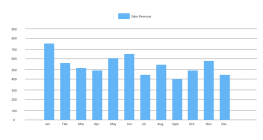
This column chart template in a business style offers a visual representation of data across four cities—City A, City B, City C, and City D—over the years 2023 to 2025. The chart highlights varying data points, with values ranging from 0 to 100, and serves as a bar chart to illustrate trends and comparisons among the cities. The axis titles provide clarity on the data being represented, making it a useful tool for analyzing business metrics and performance over the specified timeframe.
Related Recommendations
Other works by the author
Outline/Content
See more
60
2025
Axis title
100
2023
Bar chart
80
City A
0
City C
City D
City B
2024
20
40
Collect
Collect
Collect
Collect


Collect
Collect
Collect

0 Comments
Next Page