
Grouped column chart template
0 Report
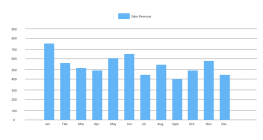
This is a grouped column chart template designed to visualize monthly data distributions over a span of two years, 2024 and 2025. The chart includes specific data points for each month, such as 30 in January, 26 in September, and 40 in both April 2024 and March 2025. It provides a clear comparison of values across different months, highlighting trends and patterns. This template can be used to effectively present data insights for various purposes, such as business analysis or project tracking, allowing for a comprehensive understanding of monthly variations.
Related Recommendations
Other works by the author
Outline/Content
See more
30
January
Unit: XX
26
September
13
24
April
40
August
27
June
35
Title
February
15
December
20
2025
10
March
2024
November
18
32
October
May
July
Collect
Collect
Collect

Collect
Collect

Collect

Collect

Collect

0 Comments
Next Page