
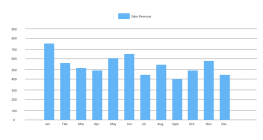
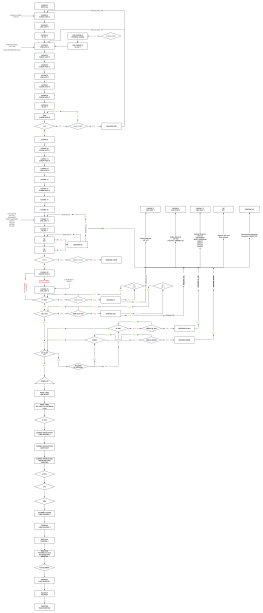
Multi-line chart template
0 Report
This is a multi-line chart template designed to visualize data trends over a specified period. The chart includes data points labeled with months such as January, February, and March, and continues through December, representing the years 2024 and 2025. Each data point is associated with a unit labeled 'XX,' indicating variable measurements across different months. This template is useful for analyzing fluctuations and patterns in data across multiple lines, providing a clear overview of changes over time. It is a valuable tool for tracking and comparing metrics in various contexts.
Related Recommendations
Other works by the author
Outline/Content
See more
30
2025
10
Unit: XX
February
45
40
May
55
25
36
27
41
57
September
60
48
31
January
July
11
June
November
August
24
39
December
October
2024
35
March
Title
18
59
29
20
50
April
43
Collect
Collect
Collect
Collect

Collect
Collect

Collect

0 Comments
Next Page