
Percentage stacked line chart
0 Report
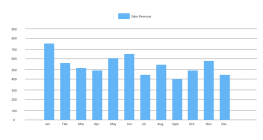
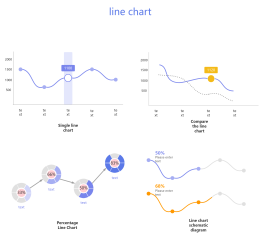
This percentage stacked line chart illustrates the distribution of users by age group across different products, specifically Products A, B, C, and D. It provides a visual representation of user demographics, segmented into age groups 0-19, 20-39, 40-59, and over 60, highlighting the percentage of users for each product. This chart is an insightful tool for understanding age-related user trends and preferences, allowing for targeted marketing strategies and product development.
Related Recommendations
Other works by the author
Outline/Content
See more
0
100%
Product C
Percentage of users by age group for different products
ProductD
80%
Over60
0-19
60%
40-59
Product A
20-39
20%
40%
ProductB
Collect
Collect
Collect
Collect
Collect
Collect
Collect

0 Comments
Next Page