
Vertical grouped bar chart template
2 Report
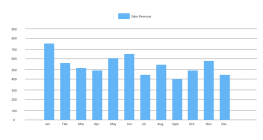
This vertical grouped bar chart template serves as a visual tool to compare data across two projects, A and B. It organizes data items 1 through 9, showcasing their respective values ranging from 0 to 200 units. This template effectively highlights differences and similarities between the projects, providing a clear and concise overview of data distribution. By using this chart, users can easily interpret complex data sets and make informed decisions based on visual comparisons. Ideal for presentations, this template enhances data comprehension and aids in strategic planning.
Related Recommendations
Other works by the author
Outline/Content
See more
0
120
Project B
160
Data Item 1
Data item 9
Data Item 6
40
80
Data Item 2
Unit: **
Vertical Grouped Bar Chart Template
Data Item 3
Data Item 4
Data item 8
Data item 7
Data item 5
Project A
200
Collect
Collect
Collect
Collect
Collect
Collect

Collect

0 Comments
Next Page