
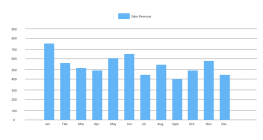
Gantt chart of special work schedule
3 Report
This Gantt chart outlines a special work schedule designed to optimize and monitor project performance over a four-week period. The first week involves statistical analysis and data collection on runtime duration and resource consumption. By the second week, component configuration parameters are gathered, and online project monitoring begins. The third week focuses on formulating and implementing an optimization plan, while the fourth week is dedicated to data acquisition and conducting a connectivity test for monitoring indicators. The entire process aims to quantify and analyze data, with the ultimate goal of achieving optimization by August 2024, extending into September for indicator sorting.
Related Recommendations
Other works by the author
Outline/Content
See more
The second week
Optimization follow-up
Collect component configuration item parameters
online
Project launch
Fourth week
Data acquisition
Monitoring indicator connectivity test
The third week
Optimization plan
Online monitoring
stage
The first week
Completed
Optimization analysis
In progress
Quantify and analyze the data
not started
Formulate an optimization plan
August 2024
Statistical analysis
Obtain the optimization goal and conduct in-depth analysis
Perform quantitative analysis after optimization
start
Collect runtime duration and resource consumption data
Monitor indicators for implementation optimization
September 2024
Monitoring Indicator Sorting
Collect
Collect
Collect
Collect
Collect
Collect
Collect

0 Comments
Next Page