
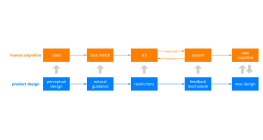
System performance test logic diagram
0 Report
This is a system performance test logic diagram, designed to illustrate the process of evaluating a system's functionality and performance. The flowchart outlines a series of steps, starting with a system function test to ensure requirements are met. If successful, the process moves to a system operation test. If any requirements are not met, the system undergoes modification before retesting. Fault tolerance testing is also included to ensure system reliability. The process concludes with an overall performance test, culminating in a comprehensive evaluation and test report. This diagram serves as a guide for systematic performance assessment.
Related Recommendations
Other works by the author
Outline/Content
See more
System Function Test
Meet the requirements
Y
Evaluation Report
System operation test
N
System fault tolerance testing
Start testing
System modification
End test
Test report
Overall performance test
Collect
Collect
Collect
Collect
Collect
Collect
Collect

0 Comments
Next Page