
Rose chart, ring chart, timeline
5 Report
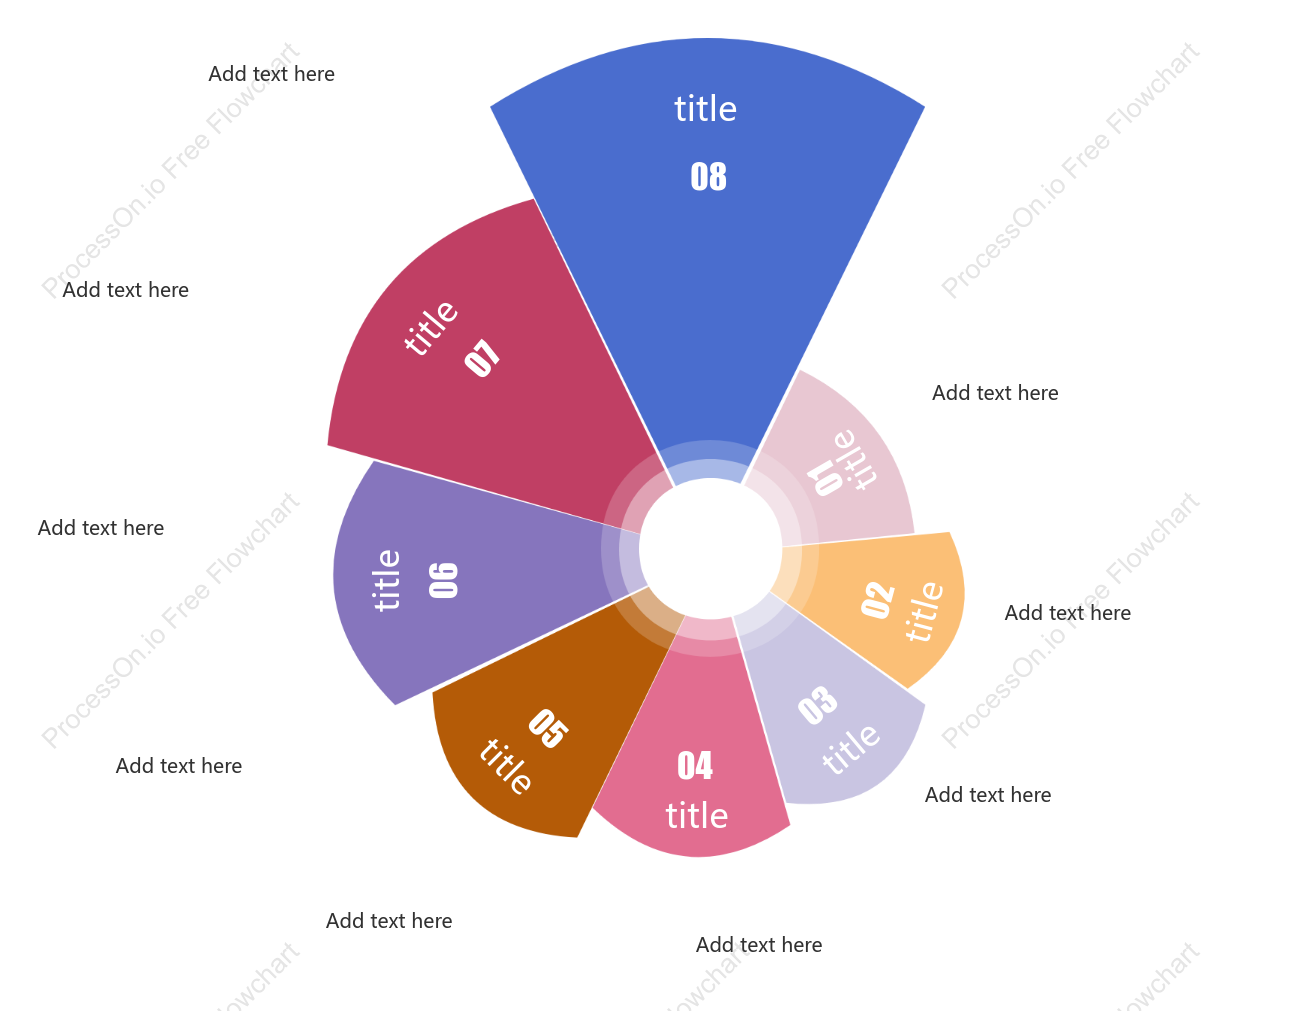
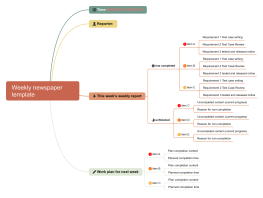
This diagram presents a comprehensive overview of data visualization techniques, specifically focusing on rose charts, ring charts, and timelines. It systematically outlines the steps and components involved in creating these visual representations, with each section detailing specific titles and additional explanatory text. This structured approach aims to enhance understanding and facilitate the effective use of these charts in various applications. By following the outlined steps, users can gain insights into the construction and interpretation of rose and ring charts, as well as the chronological representation of data through timelines.
Related Recommendations
Other works by the author
Outline/Content
See more
06
title
Add text here
04
03
02
07
08
01
05
Collect
Collect
Collect

0 Comments
Next Page