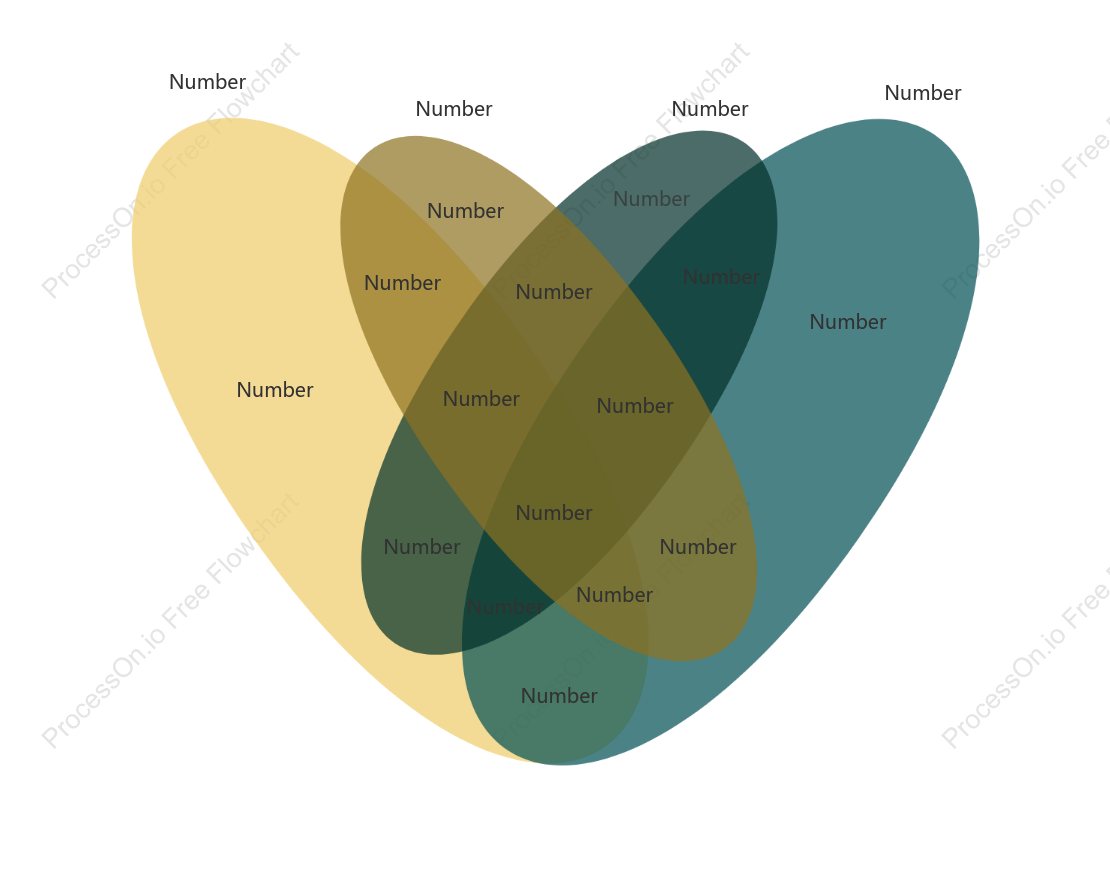

OTU comparison Venn diagram
0 Report
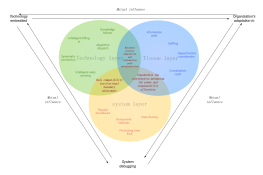
This is an OTU comparison Venn diagram, designed to illustrate the overlap and uniqueness of operational taxonomic units (OTUs) across different samples or conditions. The diagram presents a series of numerical data points that represent the presence or absence of specific OTUs, allowing for a visual comparison of microbial communities. By analyzing these numbers, researchers can identify shared and distinct microbial populations, providing insights into ecological relationships and diversity patterns. This tool is essential for understanding the complexity of microbial ecosystems and can aid in the study of environmental and health-related microbial dynamics.
Related Recommendations
Other works by the author
Outline/Content
See more
Number

Collect

Collect
Collect


0 Comments
Next Page