
Fishbone diagram - the rise and fall of Japanese semiconductors
0 Report
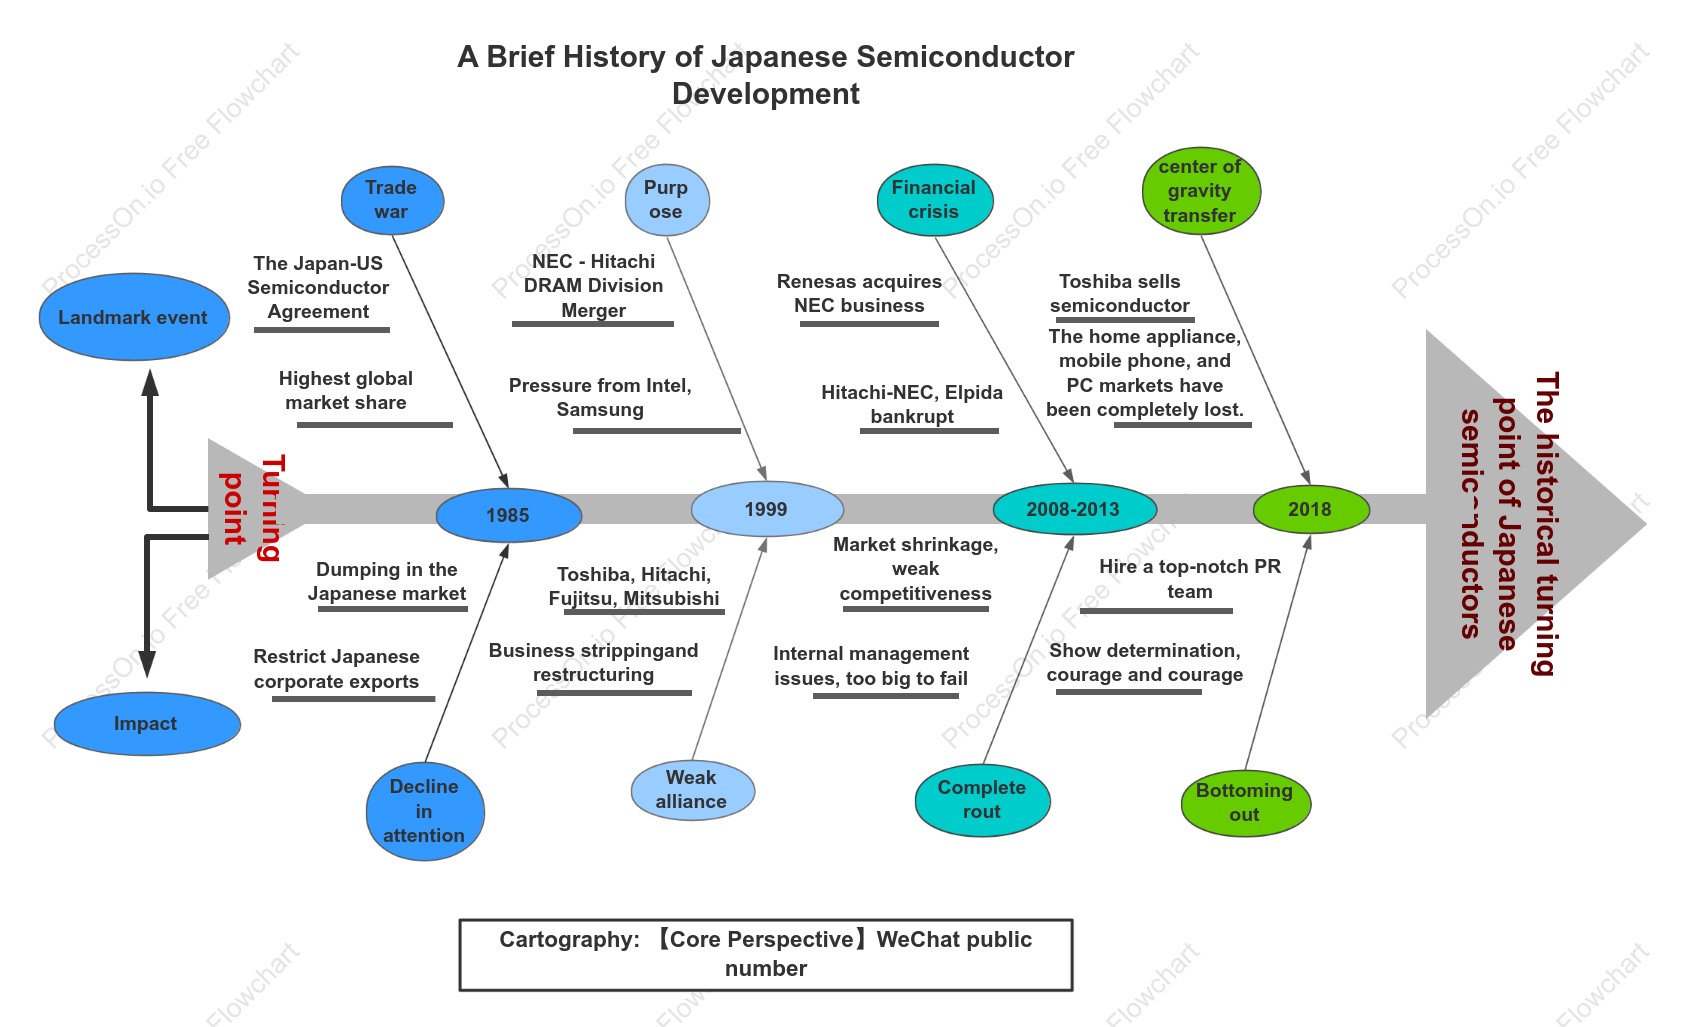
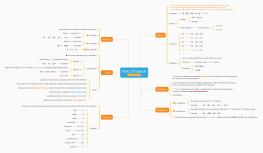
This fishbone diagram illustrates the rise and fall of the Japanese semiconductor industry, highlighting key events and turning points from 1985 to 2018. It covers the highest global market share achieved by Japanese companies, the impact of the Japan-US Semiconductor Agreement, and the subsequent decline due to factors like export restrictions and trade wars. Significant events such as the NEC-Hitachi DRAM Division merger, Toshiba's semiconductor sale, and Renesas acquiring NEC's business are noted as pivotal moments. The diagram serves as a cartographic representation of the industry's historical trajectory, emphasizing the financial crises and restructuring efforts that marked its evolution.
Related Recommendations
Other works by the author
Outline/Content
See more
2008-2013
Turning point
1985
Restrict Japanese corporate exports
Decline in attention
Highest global market share
Hire a top-notch PR team
Dumping in the Japanese market
Business strippingand restructuring
center of gravity transfer
Renesas acquires NEC business
Toshiba sells semiconductor
Bottoming out
Landmark event
Complete rout
NEC - Hitachi DRAM Division Merger
Purpose
Financial crisis
2018
1999
Trade war
Cartography: 【Core Perspective】WeChat public number
Weak alliance
A Brief History of Japanese Semiconductor Development
The Japan-US Semiconductor Agreement
Impact
The historical turning point of Japanese semiconductors
Collect

Collect
Collect
Collect
Collect
Collect
Collect

0 Comments
Next Page