
Basic Nightingale rose chart
0 Report
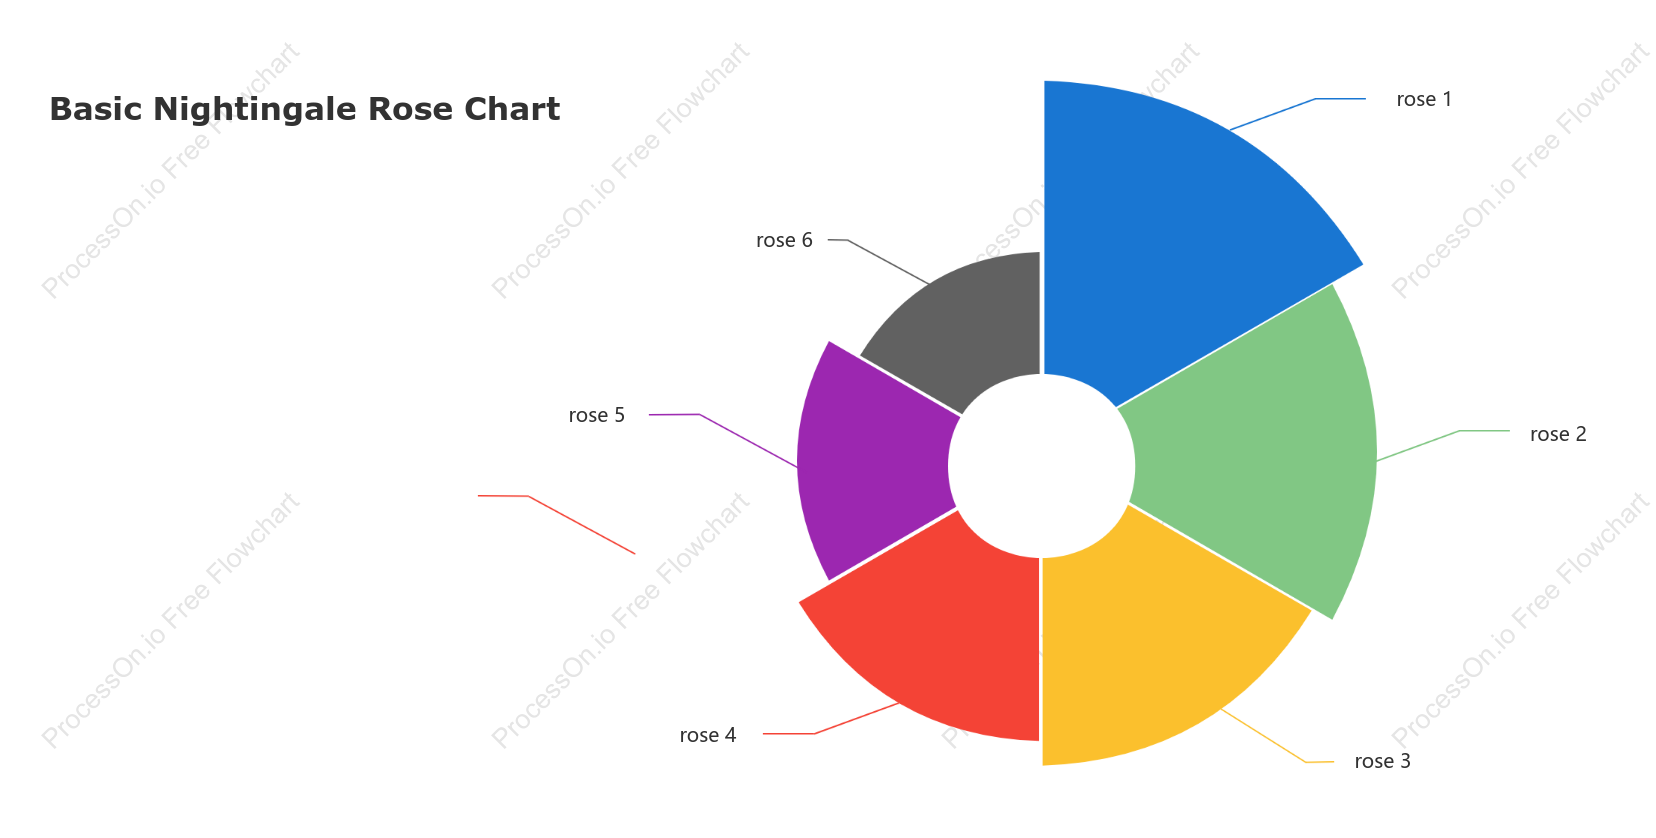
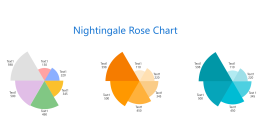
This is a Basic Nightingale Rose Chart, designed to visually represent data in a circular format, similar to a pie chart, but with a focus on displaying variations in data magnitude across different categories. The chart includes six distinct sections: rose 1, rose 2, rose 3, rose 4, rose 5, and rose 6. Each section represents a specific data category, allowing for easy comparison and analysis. This type of chart is particularly useful for illustrating changes over time or differences between groups, providing a clear and concise visual summary of complex data sets.
Related Recommendations
Other works by the author
Outline/Content
See more
rose 4
rose 1
rose 6
rose 5
rose 2
rose 3
Basic Nightingale Rose Chart
Collect

Collect

0 Comments
Next Page