
Compound pie chart template
4 Report
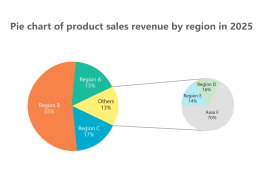
This compound pie chart template serves as a versatile tool for visually representing data distributions across multiple categories. The chart is designed to display various percentages, including 19%, 75%, 17%, 18%, 45%, 15%, and 21%, providing a comprehensive overview of the data. Each segment of the pie chart is labeled with content text, allowing for easy interpretation and comparison of different data points. This template can be particularly useful for presentations and reports that require clear and concise data visualization, aiding in effective communication and decision-making processes.
Related Recommendations
Other works by the author
Outline/Content
See more
Content text
19%
75%
Title Text
17%
18%
45%
15%
21%
Collect
Collect
Collect
Collect

Collect
Collect

0 Comments
Next Page