
Active user growth line chart
10 Report
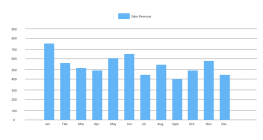
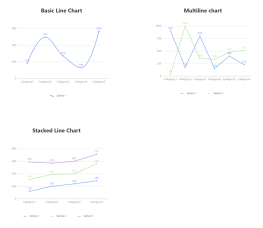
This is an active user growth line chart, illustrating the trends in user growth from January to June 2025. The chart highlights key events such as Event A in March, Event B in May, and Event C in June, which significantly impacted user acquisition. The data, represented in ten thousand users, shows a steady increase from 2 in February to 12 in June. This comparison chart provides insights into the effectiveness of new user acquisition activities over the six-month period, offering valuable information for strategic planning and analysis.
Related Recommendations
Other works by the author
Outline/Content
See more
February
June
User Growth (in ten thousand)
2
6
Event B
4
8
Comparison chart of new user acquisition activities from January to June 2025
May
10
0
Month
Event C
12
April
Event A
January
March
Collect
Collect
Collect
Collect
Collect
Collect
Collect

0 Comments
Next Page