
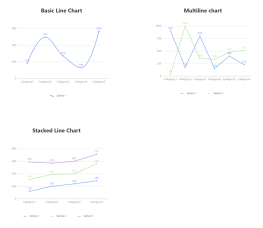
Website visits line chart
0 Report
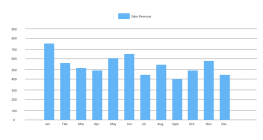
This is a website visits line chart, illustrating the visit volume over the past seven days. The chart captures daily visit data from May 1 to May 7, 2025, with visit counts ranging from 500 to 3500. It highlights trends in web and app traffic, providing insights into user engagement patterns. The line chart serves as a valuable tool for analyzing fluctuations in website traffic and understanding user behavior during this period. This visualization is designed to assist in making informed decisions based on visit trends and patterns.
Related Recommendations
Other works by the author
Outline/Content
See more
Visit volume in the past 7 days
500
2025-05-05
2025-05-04
2025-05-07
2000
2500
3500
Visit trend chart
访问量
1000
3000
2025-05-06
Web
2025-05-01
APP
2025-05-03
1500
0
2025-05-02
Collect
Collect
Collect
Collect
Collect
Collect
Collect
Collect

0 Comments
Next Page