
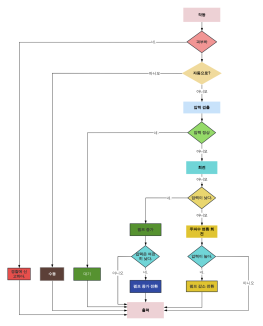
SCI(과학인용지수) 필수 흐름도
0 보고서
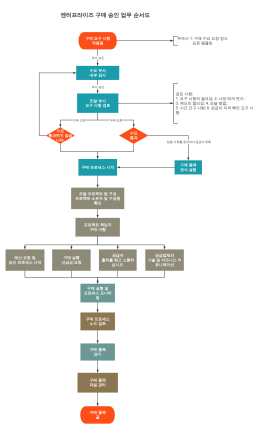
이 템플릿은 SCI 논문 작성 및 학술 연구 시나리오에 맞춰 특별히 설계되었습니다. 연구 방법의 실행 흐름, 실험 설계의 구체적인 단계, 데이터 수집 및 처리 과정, 체계적 문헌 검토를 위한 문헌 선정 논리 등을 설명하는 데 적합합니다. 표준화된 학술적 흐름도 구조를 통해 "연구 질문 제시"부터 "결론 도출"까지 연구의 전체적인 기술적 과정을 명확하게 보여줍니다. SCI 저널 투고 요건인 명확하고 표준화된, 편집 용이한 그림과 표를 위해 단순한 기하학적 도형(사각형, 마름모, 화살표)과 회색조 색상 구성을 권장합니다. 논문 본문, 보충 자료, 학술 발표 자료, 프로젝트 제안서 등에 그림이나 도표로 활용하기에 적합합니다.
관련 권장 사항
저자의 다른 작품
개요/내용
더 보기
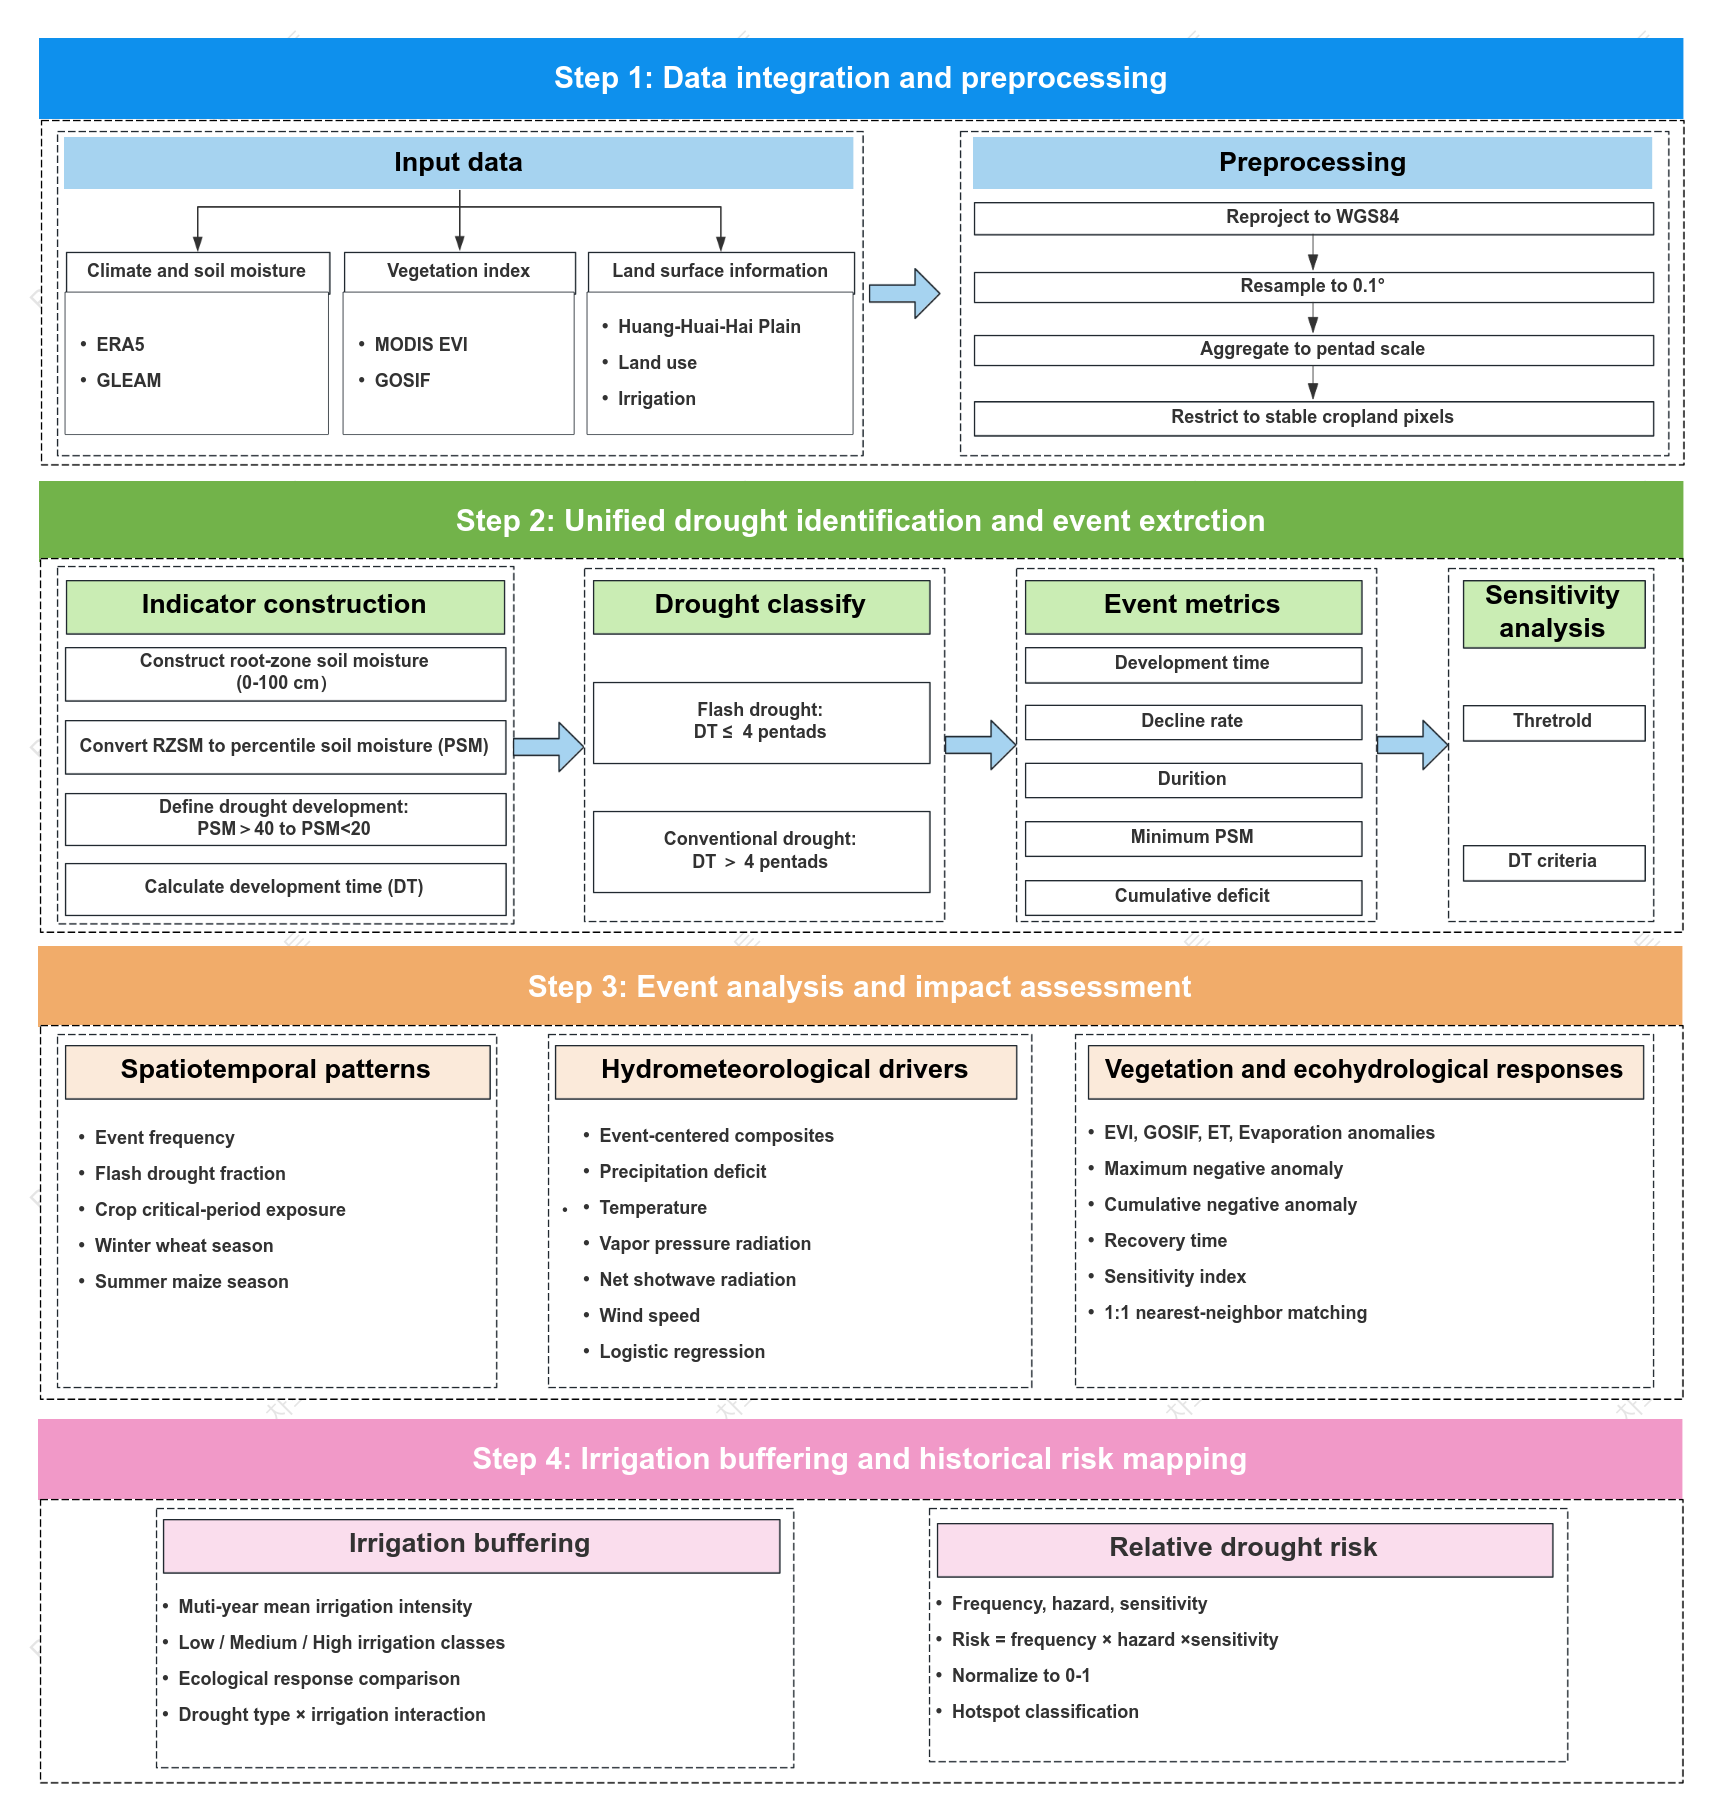
Indicator construction
Define drought development:PSM>40 to PSM<20
Resample to 0.1°
Restrict to stable cropland pixels
Irrigation buffering
Step 3: Event analysis and impact assessment
Hydrometeorological drivers
Construct root-zone soil moisture (0-100 cm)
Vegetation and ecohydrological responses
Reproject to WGS84
Event metrics
Step 2: Unified drought identification and event extrction
Input data
Convert RZSM to percentile soil moisture (PSM)
Muti-year mean irrigation intensityLow / Medium / High irrigation classesEcological response comparisonDrought type × irrigation interaction
Climate and soil moisture
Thretrold
Event frequencyFlash drought fractionCrop critical-period exposureWinter wheat seasonSummer maize season
Step 1: Data integration and preprocessing
Preprocessing
Vegetation index
Spatiotemporal patterns
Huang-Huai-Hai PlainLand useIrrigation
DT criteria
Flash drought:DT ≤ 4 pentads
Aggregate to pentad scale
ERA5GLEAM
MODIS EVIGOSIF
Relative drought risk
Durition
Decline rate
Sensitivity analysis
Conventional drought:DT > 4 pentads
Minimum PSM
Cumulative deficit
Drought classify
Development time
Calculate development time (DT)
Land surface information
Step 4: Irrigation buffering and historical risk mapping
Event-centered compositesPrecipitation deficitTemperatureVapor pressure radiationNet shotwave radiationWind speedLogistic regression
즐겨찾기
즐겨찾기
즐겨찾기
즐겨찾기

0 댓글
다음 페이지